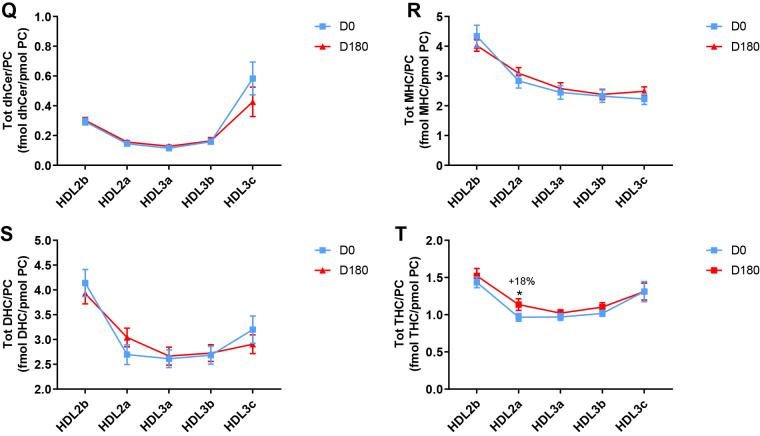
Fig. 1.
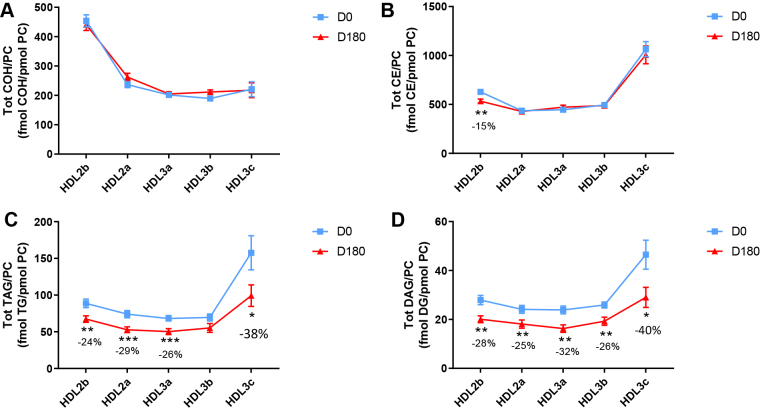
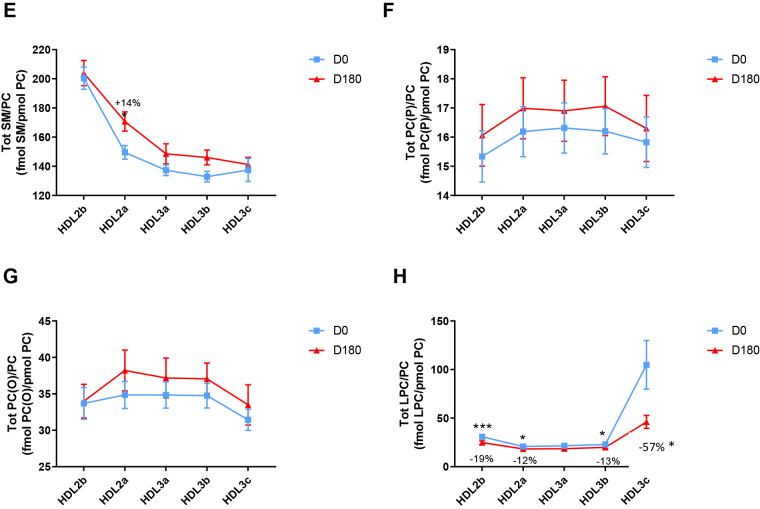
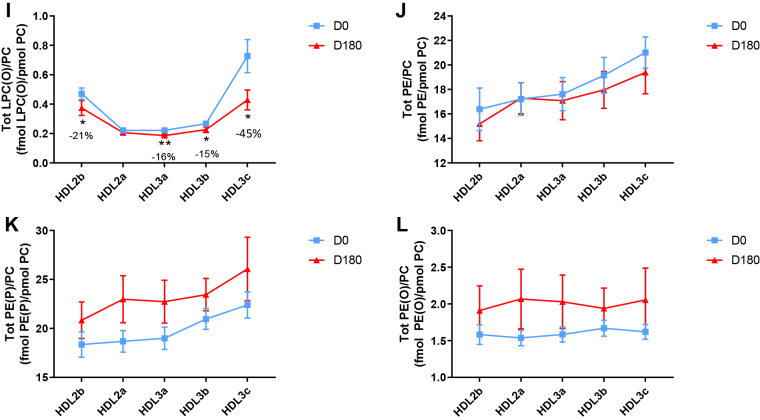
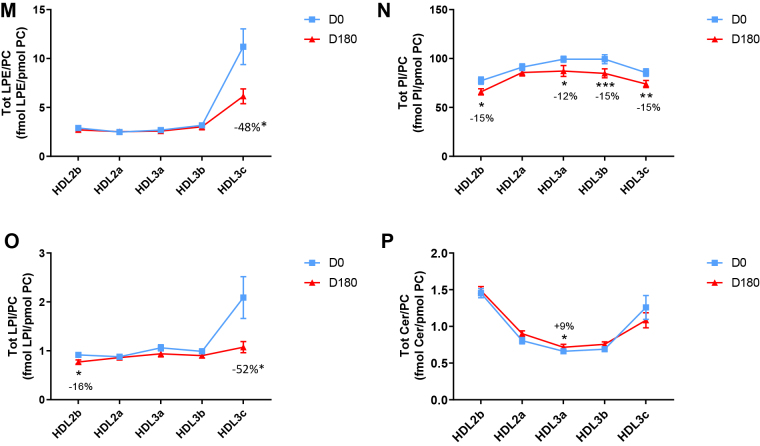
The effect of pitavastatin calcium treatment (4 mg/day) for 180 days (D180) on baseline plasma concentrations of lipid classes normalized to moles PC in HDL2b, HDL2a, HDL3a, HDL3b, and HDL3c subclasses in hypertriglyceridemic subjects. Data are expressed as means ± SEM (n = 12) in fmol of each lipid class/pmol PC. Percent change (%) was calculated relative to baseline values (D0). ∗∗∗P < 0.001; ∗∗0.001 < P < 0.01; and ∗0.01 < P < 0.05 versus D0. Hydrated density ranges of HDL subclasses are: HDL2b = 1.063–1.091 g/ml, HDL2a = 1.091–1.110 g/ml, HDL3a = 1.110–1.133 g/ml, HDL3b = 1.133–1.156 g/ml, and HDL3c = 1.156–1.179 g/ml. Panels A to V: A: COH, free cholesterol; B: CE, cholesteryl ester; C: TAG, triacylglycerol; D: DAG, diacylglycerol; E: SM, sphingomyelin; F: PC(P), alkenylphosphatidylcholine (plasmalogen); G: PC(O), alkylphosphatidylcholine; H: LPC, lysophosphatidylcholine; I: LPC(O), lysoalkylphosphatidylcholine; J: PE, phosphatidylethanolamine; K: PE(P), alkenylphosphatidylethanolamine (plasmalogen); L: PE(O), alkylphosphatidylethanolamine; M: LPE, lysophosphatidylethanolamine; N: PI, phosphatidylinositol; O: LPI, lysophosphatidylinositol; P: Cer, ceramide; Q, dhCer, dihydroceramide; R: MHC, monohexosylceramide; S: DHC, dihexosylceramide; T: THC, trihexosylceramide; U: GM3, monosialodihexosylganglioside; V: CE/TAG ratio.

