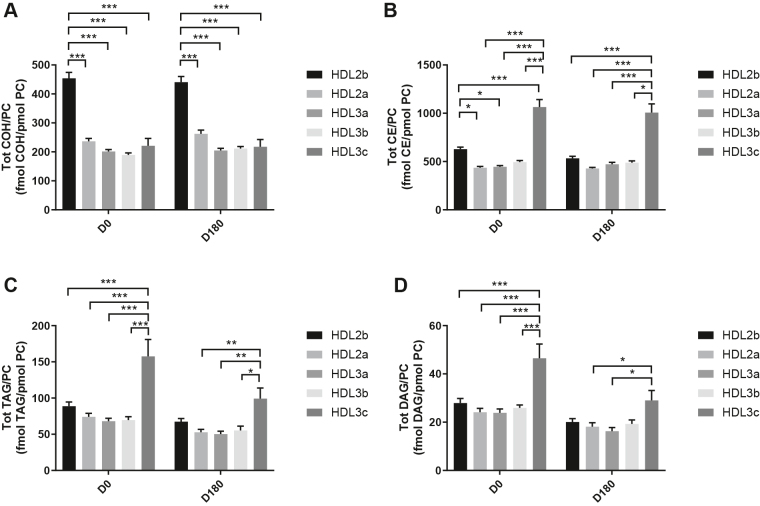
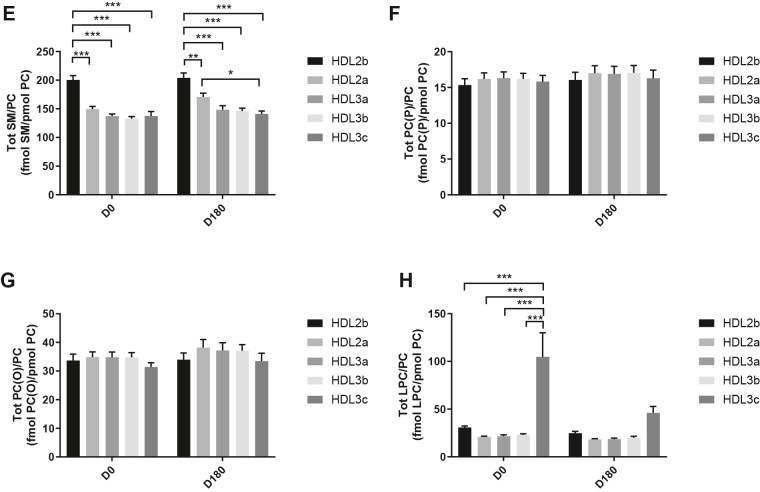
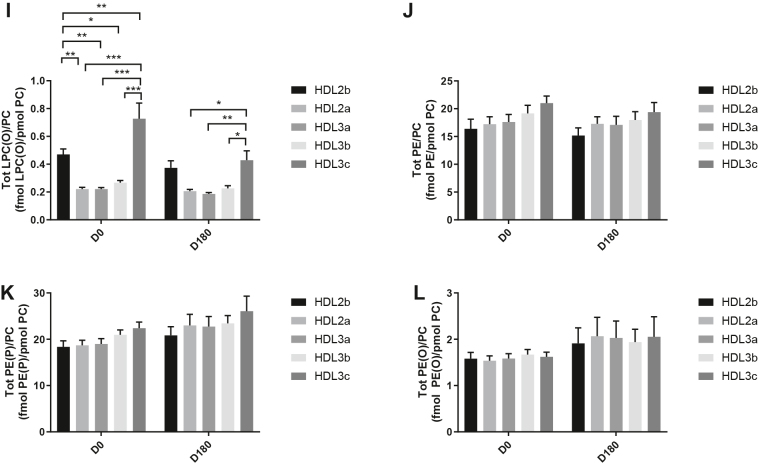
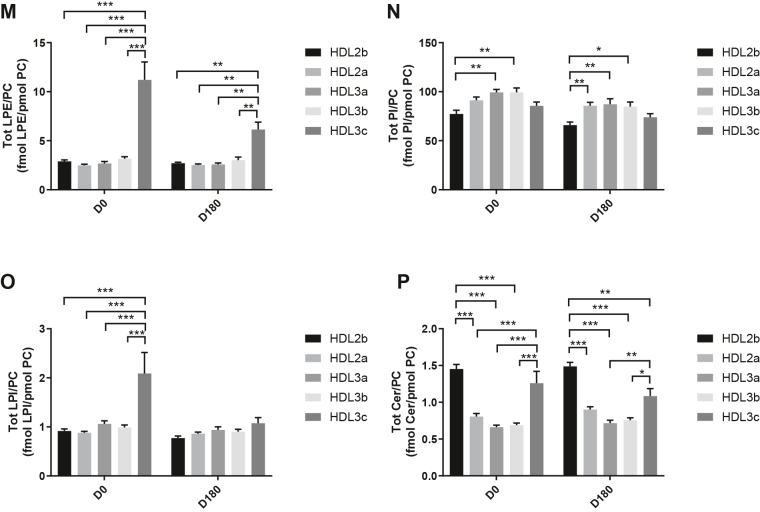
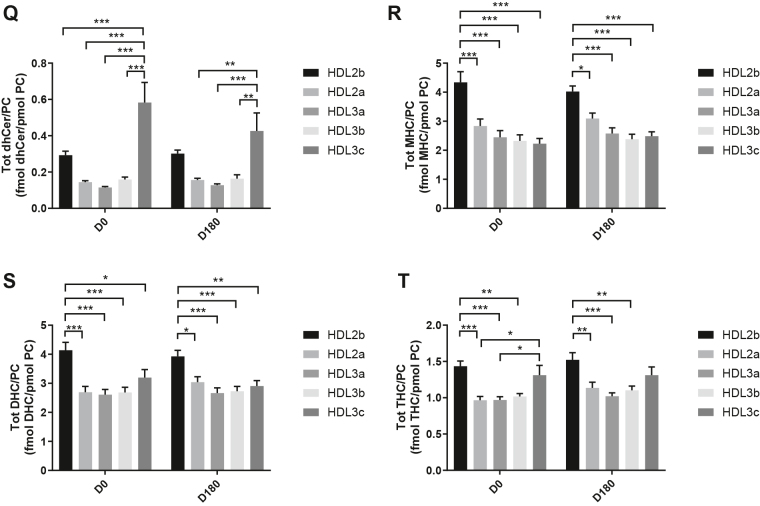
Fig. 2.
Statistical analyses of differences between plasma concentrations of lipid classes normalized to PC in HDL2b, HDL2a, HDL3a, HDL3b and HDL3c at baseline (D0) (at left) and following pitavastatin treatment (4 mg/day) for 180 days (D180) (at right) in hypertriglyceridemic subjects. Data are expressed as means ± SEM (n=12) in pmol of each lipid class/pmol PC. Density ranges: HDL2b = 1.063–1.091 g/mL, HDL2a = 1.091–1.110 g/mL, HDL3a = 1.110–1.133 g/mL, HDL3b = 1.133–1.156 g/mL, and HDL3c = 1.156–1.179 g/mL. ∗∗∗P < 0.001; ∗∗0.001 < P < 0.01; and ∗0.01 < P < 0.05 vs D0. Panels A to V: A – COH: free cholesterol; B – CE: cholesteryl ester; C – TAG: triacylglycerol; D – DAG: diacylglycerol; E – SM: sphingomyelin; F – PC(P): alkenylphosphatidylcholine (plasmalogen); G – PC(O): alkylphosphatidylcholine; H – LPC: lysophosphatidylcholine; I – LPC(O): lysoalkylphosphatidylcholine; J – PE: phosphatidylethanolamine; K – PE(P): alkenylphosphatidylethanolamine (plasmalogen); L – PE(O): alkylphosphatidylethanolamine; M – LPE: lysophosphatidylethanolamine; N – PI: phosphatidylinositol; O – LPI: lysophosphatidylinositol; P – Cer: ceramide; Q – dhCer: dihydroceramide; R – MHC: monohexosylceramide; S – DHC: dihexosylceramide; T – THC: trihexosylceramide; U – GM3: monosialodihexosylganglioside; V – CE/TAG ratio.

