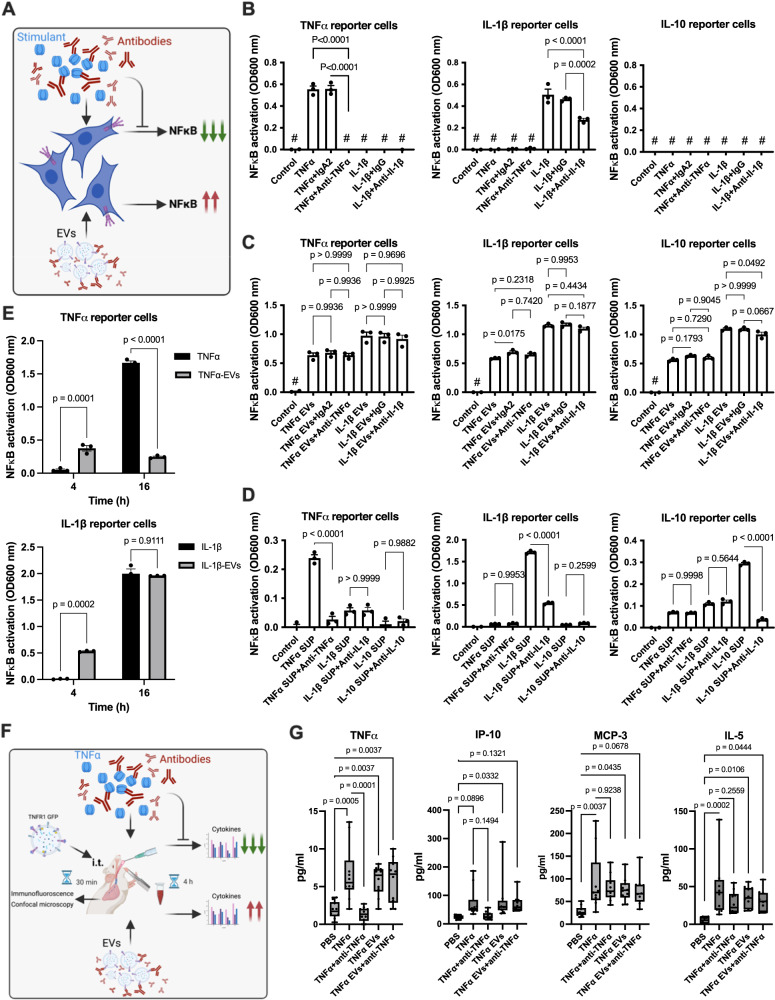
Fig. 6. In vitro and in vivo role of receptor bound ligands for EV-mediated cell stimulation.
A Schematic diagram illustrating the significance of ligand-receptor immune complexes in triggering signaling in recipient cells (Created with BioRender.com). TNFα, IL-1β, and IL-10 HEK-Blue™ reporter cell lines were stimulated with TNFα, IL-1β, and IL-10 (B) or LPS-EVs (from 1 × 10⁶ stimulated HEK293 cells) (C) in the presence or absence of neutralizing antibodies. IgA2 and IgG isotype antibodies were used as controls. NF-κB activation was measured after an overnight incubation. P-values determined by ordinary one-way ANOVA with Tukey’s multiple comparisons test (SEM; n = 3, of different measurements). D TNFα, IL-1β, and IL-10 HEK-Blue™ reporter cell lines were incubated with EV-free supernatants in the presence or absence of neutralizing antibodies. IgA2 and IgG isotype antibodies were used as controls. NF-κB stimulation was determined after an overnight incubation. P-values determined by ordinary one-way ANOVA with Tukey’s multiple comparisons test (SEM; n = 3, of different measurements). E TNFα-HEK-Blue™ reporter cells were incubated with TNFα or TNFα-EVs (from the 1 x 10⁶ TNFα-HEK-Blue™ reporter cells). IL-1β -HEK-Blue™ reporter cells were incubated with IL-1β or IL-1β -EVs (from 1 x 10⁶ IL-1β-HEK-Blue™ reporter cells). NF-κB stimulation was measured 4 h and 16 h after stimulation. P values determined by ordinary two-way ANOVA with Tukey’s multiple comparisons test (SEM; n = 3, of different measurements). F The schematic diagram shows the experimental design of the in vivo experiments (Created with BioRender.com). G. Mice were challenged with TNFα or TNFα-EVs (from 200 million THP1 cells/mouse) in the presence or absence of neutralizing anti-TNFα antibodies (10 µg/mouse). An IgA2 antibody (10 µg/mouse) served as a negative control. 2 h after treatment, blood samples were collected and analyzed for TNFα, IP10, MCP-3, and IL-5 levels. P-values determined by two-way ANOVA with Tukey’s multiple comparisons test. (SEM; n = 10 mice per group).

