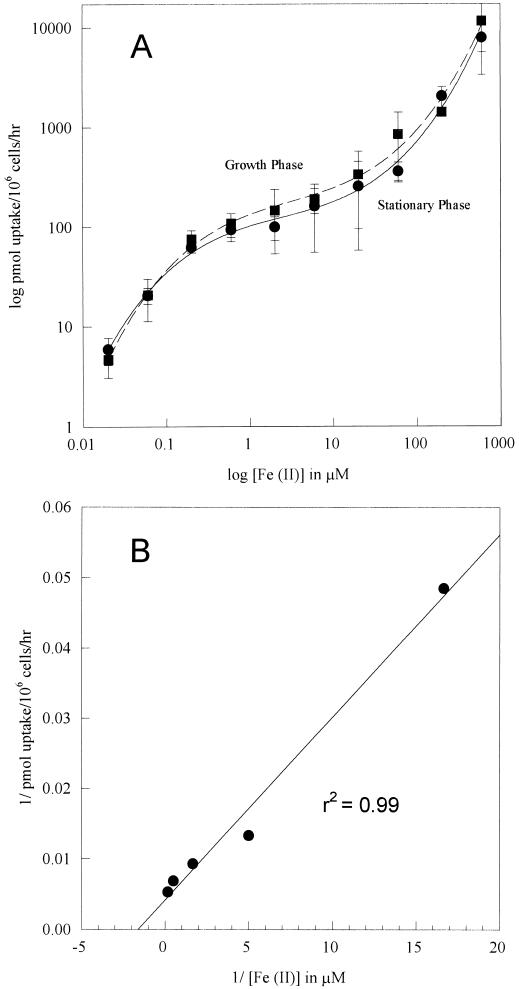
FIG. 1.
Fe(II) uptake by growth-phase and stationary-phase cells. (A) Velocity depicted as a function of concentration. A logarithmic plot was used in order to encompass a 5-log-unit variation in Fe(II) concentrations. Error bars indicate standard deviations. (B) Double-reciprocal plot of low-concentration data from an exponentially growing culture. The experiment was performed three times, and representative results are shown.

