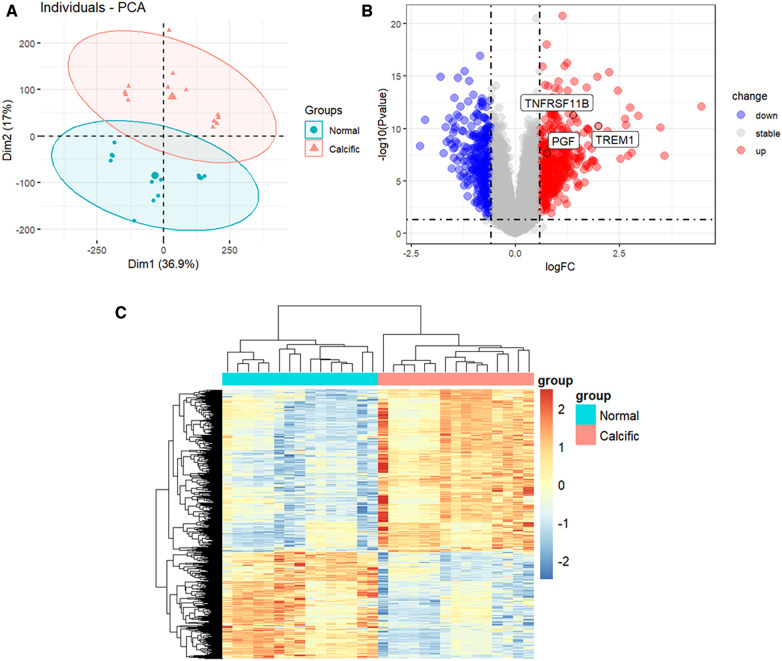
Figure 2.
Identification of DEGs between normal and calcified aortic valves. (A) PCA for normal and calcified aortic valves. (B) Volcanic map of the DEGs between normal and calcified aortic valves based on P < 0.05 and |log2FC| >0.585 as threshold parameters. Red dots represent upregulated genes. Blue dots represent downregulated genes. (C) Heatmap of the DEGs. Upregulated genes are shown in red. Downregulated genes are shown in blue.

