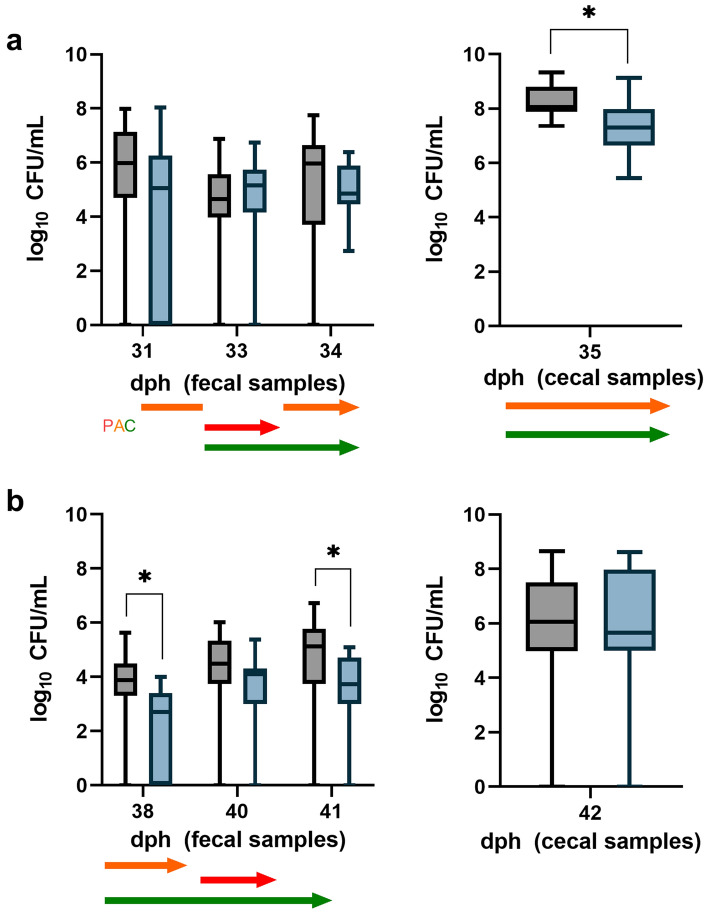
Figure 1.
Comparison of Campylobacter counts of a control group (black boxplots) and experimental group PAC (turquoise boxplots) in field trial design 1. Birds in the experimental group PAC received a phage mixture (1.0 × 10⁷ PFU/bird), an organic acid blend via drinking water, and curcumin (160 mg/kg) via feed. Treatment of experimental group PAC: orange arrow = organic acid blend, red arrow = phage mixture, green arrow = curcumin. (a) Campylobacter counts in fecal and cecal samples until thinning. At day 31, samples were taken first and afterwards dosing was started. (b) Campylobacter counts of fecal and cecal samples after thinning until slaughter (n = 19). Boxplots indicate minimum, maximum, upper and lower quartile, and median values (n = 19). Significance levels (P values) determined by Mann–Whitney U test are indicated with * (P < 0.05). dph = days post hatch.

