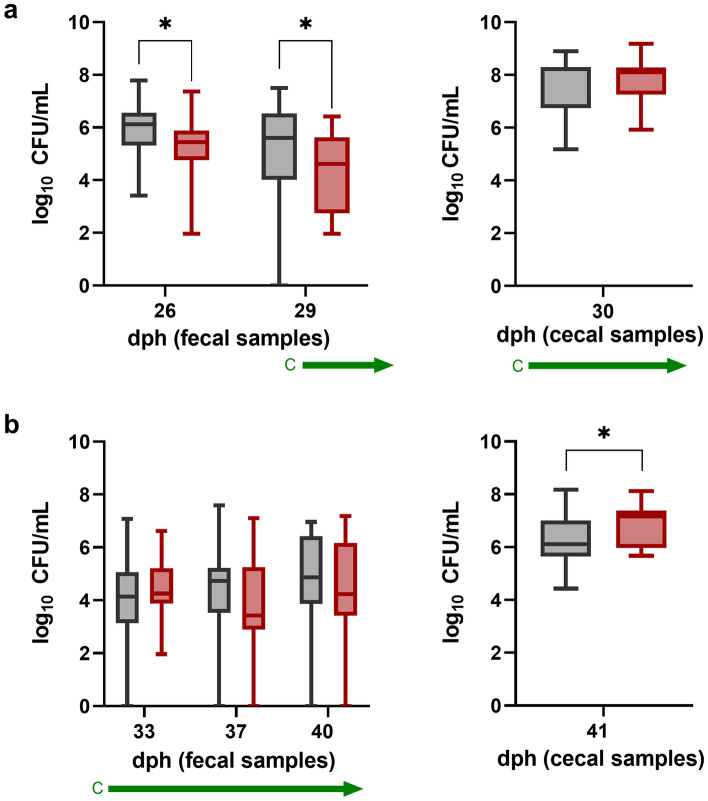
Figure 3.
Comparison of Campylobacter counts of a control group (black boxplots) and group C (red boxplots) receiving curcumin (160 mg/kg) via feed. Treatment of experimental group: green arrow = curcumin. (a) Campylobacter counts in fecal and cecal samples until thinning. (b) Campylobacter counts of fecal and cecal samples after thinning until slaughter (n = 19). Boxplots indicate minimum, maximum, upper and lower quartile, and median values (n = 19). Significance levels (P values) determined by Mann–Whitney U test are indicated with * (P < 0.05). dph = days post hatch.

