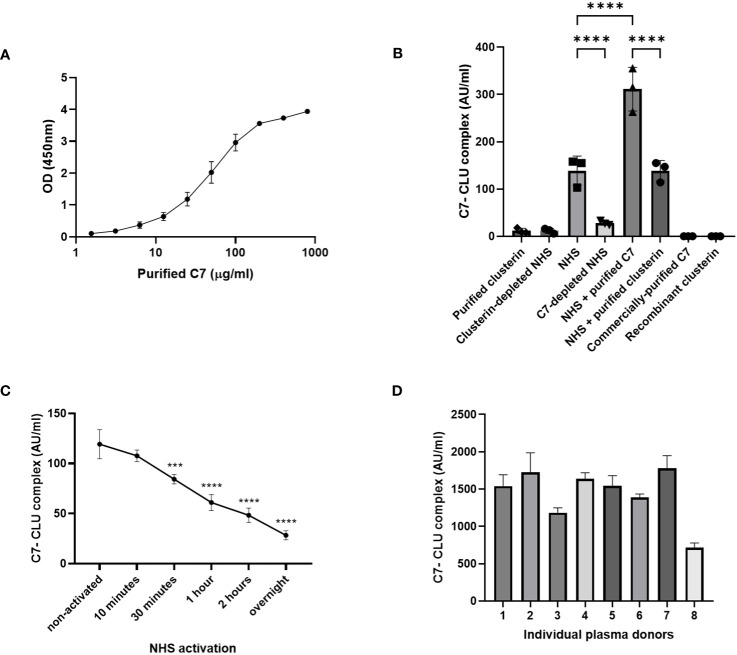
Figure 6.
C7-CLU complex was detected in purified C7 and measured in healthy serum and plasma donors. (A) OD signal of C7-CLU complex measured in C7 purified from NHS-BioIVT with the anti-C7 mAb, M7-HB2H, at the indicated concentrations. (B) C7-CLU complex measured in indicated samples. Each data point denotes an independent measurement. (C) Concentration of C7-CLU complex measured zymosan-activated NHS at indicated time points. Asterisks denote statistically significant change from non-activated NHS. (D) Concentration of C7-CLU complex in EDTA plasma from healthy donors. Data are shown as mean ± SD. The CV values in all presented datasets were below 10%. Groups were compared using one-way ANOVA followed by Tukey’s multiple comparisons test. One-way ANOVA, followed by Dunnett’s multiple comparison test was used when comparing zymosan-activated NHS against non-activated control. *** p < 0.001, **** p < 0.0001. Some error bars cannot be shown because the SD is too small.

