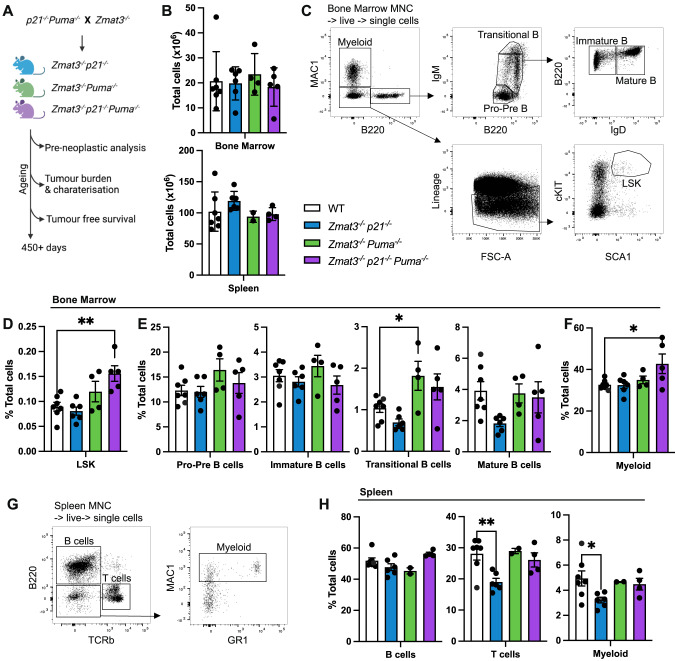
Fig. 1. Lymphoid organ analysis of young adult mice of the indicated genotypes.
A Schematic for tumour development study. Mouse cohorts were analysed for pre-neoplastic phenotypes and monitored for tumour-free survival. B–H Single-cell suspensions were prepared from spleen, thymus, peripheral blood and bone marrow of Puma−/−p21−/−Zmat3−/− (N = 5), Puma−/−Zmat3−/− (N = 2–4), p21−/−Zmat3−/− (N = 6), and wt (N = 7) mice and the indicated haematopoietic cell subsets were examined by immunostaining and FACS analysis. B Total cell counts for bone marrow (1 femur, top) and whole spleen (bottom). C Representative FACS plots from wt mice that indicate gating strategy to identify the cell populations of interest in the bone marrow: myeloid (MAC1+), LSK (Lineage-SCA1+cKIT+) haematopoietic stem/progenitor cells (HSPCs) and B lymphoid cells; pro-pre (B220loIgM-), immature (B220+IgMlo IgD-), transitional (B220+IgMhi) and mature (B220+IgMmedIgD+) B lymphoid cells. The lineage marker antibody cocktail included antibodies against NK1.1, TER119, Ly6G, F4/80, CD2, CD4 and CD8. D–F Percentages of the indicated cell subsets in the bone marrow from mice of the indicated genotypes. G Representative FACS plots of wt mice indicate gating strategy to identify cell populations in the spleen: B cells (B220+), T cells (TCRβ+) and myeloid cells (MAC1+B220-TCRβ-). H Percentages of the indicated cell subsets in the spleen of mice of the indicated genotypes. Data represent mean ± SEM. Statistical significance was calculated by one-way ANOVA *p < 0.05. N number of mice, MNC mono-nuclear cells as determined by forward/side scatter. For data of analysis of single knockout control mice, Puma−/− (N = 7), p21−/−(N = 8), Zmat3−/− (N = 6), refer to Fig. S1.

