
Fig. 2. Average depths of coverage across all targeted regions in autosomal chromosomes in WES experiments without and with multiplexing.
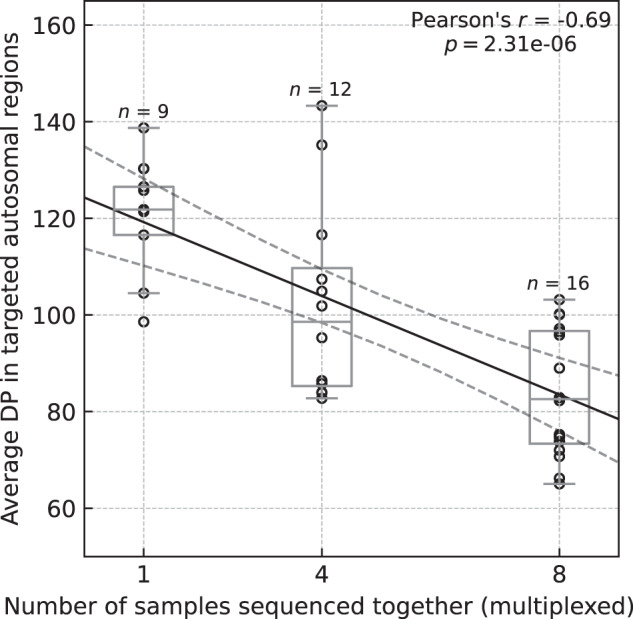
The average depth of coverage (DP) was computed across target regions in Agilent V7 capture using paired mapped reads and counting only base-pairs with minimal Phred-scaled mapping and base qualities of 20. The solid black line corresponds to the linear regression line, and the dashed black lines correspond to a 95% confidence interval. The box bounds the IQR, and Tukey-style whiskers extend to a maximum of 1.5 × IQR beyond the box. The horizontal line within the box indicates the median value. Open circles are data points corresponding to the average DP across individual exome.