FIGURE 2.
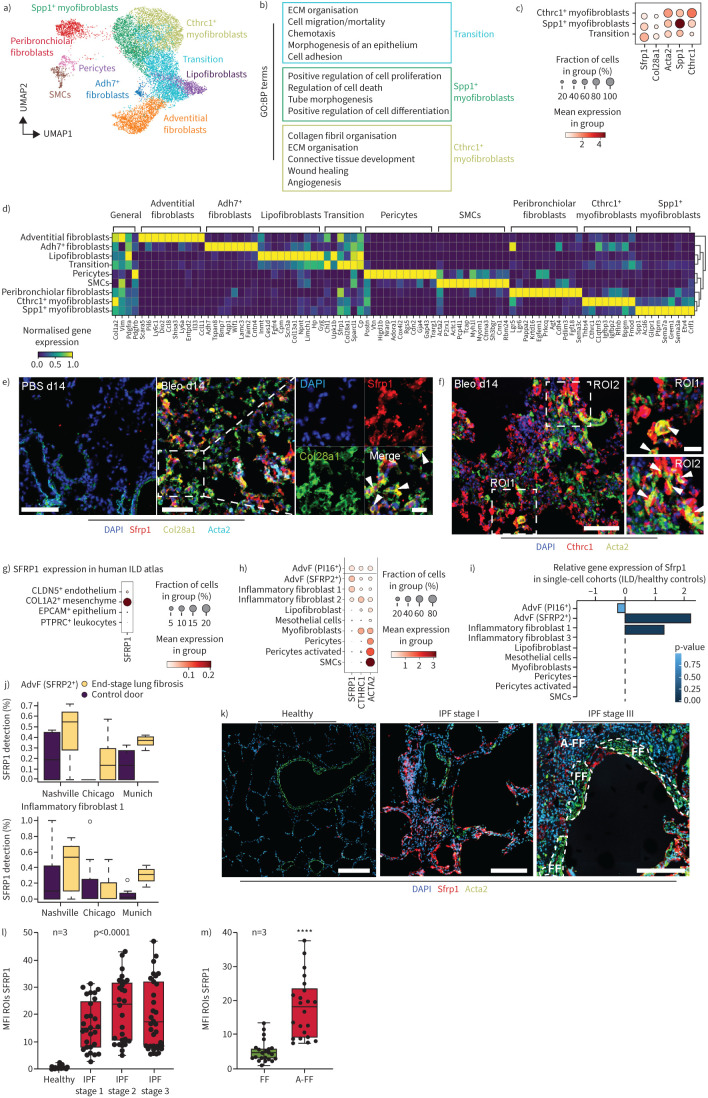
Three distinct activated mesenchymal cell types emerge after bleomycin (bleo)-induced mouse lung injury. a) Uniform manifold approximation and projection (UMAP) depicts mesenchymal cell types (n=12 254 cells) identified at day 14 (d14) after bleomycin injury. b) The marker genes of activated mesenchymal subtypes are enriched for characteristic gene ontology (GO):biological process (BP) terms. False discovery rate <10%. Top 500 marker genes considered. c) The dotplot depicts a gradient of marker gene expression across the activated cell types. d) The mesenchymal cell types are characterised with distinct gene expression profiles, as depicted in the matrixplot. e, f) Immunofluorescence analysis of lung tissue sections from bleomycin-treated mice demonstrates colocalisation of SFRP1 (red) and COL28A1 (green) 14 days after injury. Arrowheads in the magnified insets indicate SFRP1/COL28A1 double-positive cells. SFRP1/COL28A1 double-positive cells did not colocalise with α-smooth muscle actin (ACTA)2 (cyan). No expression of SFRP1 was detected in PBS controls. Scale bars=100 µm (PBS), 100 µm (Bleo d14) and 50 µm (inset). f) At d14 after injury, ACTA2 (green) and CTHRC1 (red) double-positive cells were found (indicated by arrowheads in the magnified insets for ROI1 and ROI2 in the very right panel). Nuclei in blue colour (4′,6-diamidino-2-phenylindole DAPI). Scale bars=100 µm and 20 µm (inset). g, j) Distinct markers from the bleomycin mouse model were analysed in a recently published integrated atlas of human lung fibrosis at single-cell resolution [20]. g) SFRP1 showed specific expression on human COL1A2+ positive mesenchymal cells. h) Marker gene expression across all mesenchymal cell types identified in the human lung. i, j) Differential gene expression analysis between interstitial lung disease (ILD) patient samples and healthy control samples: i) reveals significant regulation of SFRP1 in adventitial fibroblasts (AdvF) and inflammatory fibroblasts cluster 2; j) this regulation is consistent across all three cohorts in the atlas. k) Immunofluorescence analysis of micro-CT staged idiopathic pulmonary fibrosis (IPF)-patient tissues demonstrating an increase of SFRP1 (red) in regions of mild fibrosis (IPF stage I) compared to healthy controls. In regions of severe fibrosis (IPF stage III) and tissue remodelling, fibroblastic foci (white dashed lines, FF) stained positive for α-smooth muscle actin (ACTA2) (green), but mostly not for SFRP1. Adjacent to fibroblastic foci (A-FF) SFRP1 expressing fibroblasts were still present. Scale bars=200 µm. Representative images are shown. l) Quantification of SFRP1's mean fluorescence intensity (MFI) of various regions-of-interest (ROIs) from three different patients (n=3). Statistics: one-way ANOVA. m) Quantification of SFRP1 MFI in late-stage IPF comparing SFRP1 expression within fibroblastic foci (FF) and adjacent to fibroblastic foci (A-FF) from three different patients (n=3). Statistics: unpaired t-test. ****: p<0.0001. SMC: smooth muscle cell; ECM: extracellular matrix.

