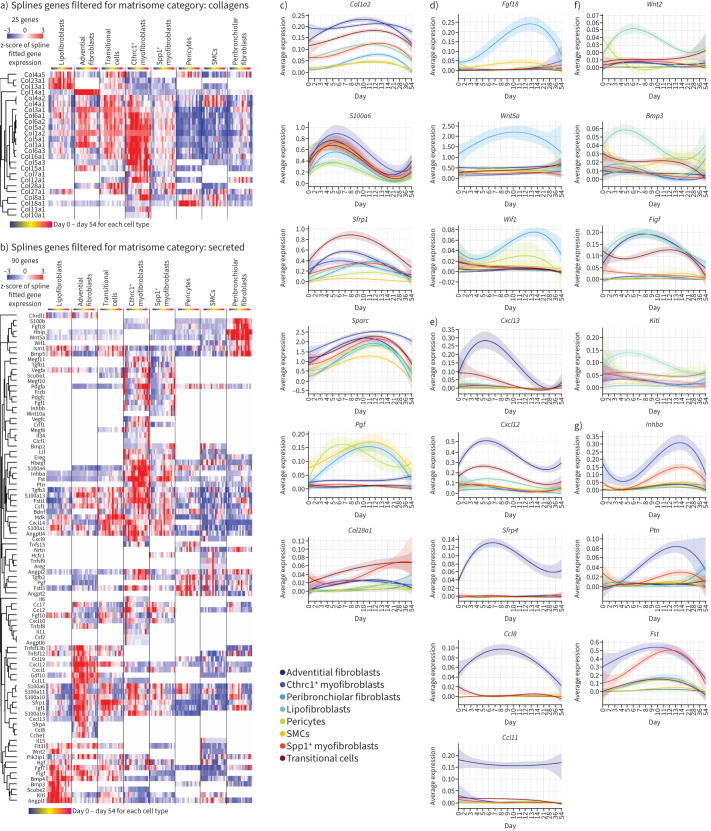
FIGURE 5.
Highly specific expression changes in distinct fibroblast lineages. a, b) Heatmaps display genes that showed differential expression along the time-course in at least one cell type using a spline regression model for a) 25 different collagens and b) 90 secreted matrisome [22] genes. c–g) Line plots show average expression of indicated genes for each cell type along the bleomycin time course, for c) general mesenchymal marker genes, d) genes regulated over time in peribronchial fibroblasts, e) adventitial fibroblast, f) lipofibroblasts and g) Cthrc1+ myofibroblasts. SMC: smooth muscle cell.

