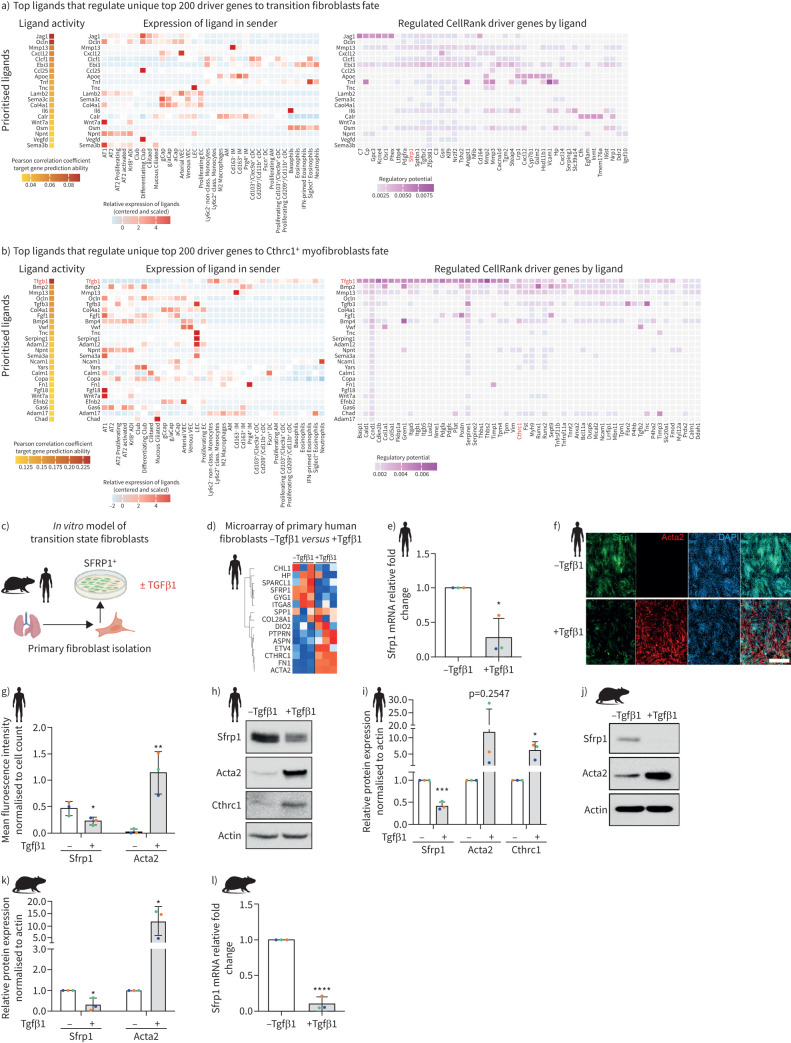
FIGURE 6.
Tgfβ1 drives conversion of Sfrp1+ transitional cells to Cthrc1+ myofibroblasts. a, b) NicheNet analysis based prediction of regulatory ligands upstream of fibroblast states. Heatmaps show top ranked ligands with highest potential of regulating the top 200 driver genes towards the fate of a) Sfrp1+ transitional fibroblasts and b) Cthrc1+ myofibroblasts. The left panel shows scaled expression of those ligands across cell types of the whole lung, while the right panel shows the top downstream target genes of each ligand. c) Experimental design. d) Heatmap shows z-scored gene expression from bulk transcriptomics after transforming growth factor (TGF)β1 treatment of primary human fibroblasts grown in vitro. e) mRNA (quantitative (q)PCR) expression of SFRP1 48 h after TGFβ1-treatment of primary human lung fibroblasts grown in vitro. f) Immunofluorescence staining and g) quantification thereof of primary human lung fibroblasts showing the expression of SFRP1 and ACTA2 with and without 48 h of TGFβ1-treatment. Scale bar=250 µm. h) Protein expression of SFRP1, ACTA2 and CTHRC1 by Western blotting and i) its quantification using human lung fibroblasts cultured in vitro for 48 h with and without TGFβ1. Representative of n=3. j) Protein expression of SFRP1 and ACTA2 by Western blotting and k) its quantification using mouse lung fibroblasts cultured in vitro for 48 h with and without TGFβ1. Representative of n=3. l) mRNA (qPCR) expression of Sfrp1 48 h after TGFβ1-treatment of primary mouse lung fibroblasts grown in vitro. All data are shown as mean±sd with n=3 from different mice or human donors. *: p<0.05, **: p<0.01, ***: p<0.001, ****: p<0.0001 by unpaired two-tailed t-tests.

