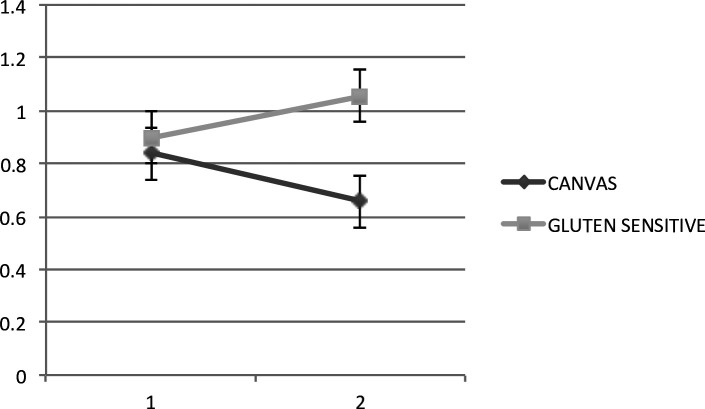
Figure 1.
N-acetyl-aspartate to creatine (NAA:Cr) ratio (vertical axis) before and after the introduction of gluten-free diet (horizontal axis in years) using magnetic resonance spectroscopy of the cerebellum. The light grey line represents the change over time in eight patients with gluten sensitivity who went on a strict gluten-free diet, showing improvement in the NAA:Cr area ratio, associated with clinical improvement (mean NAA:Cr 0.8975, follow-up 1.055, p=0.0192). We have previously demonstrated a very good correlation between the NAA:Cr ratio and SARA score. The dark grey line represents the four patients with gluten sensitivity and a subsequent diagnosis of biallelic RFC1 expansion, demonstrating that despite the gluten-free diet they continue to deteriorate (mean 0.8375, follow-up 0.6575, p=0.0216). CANVAS, cerebellar ataxia, neuropathy (sensory ganglionopathy) and vestibular areflexia syndrome; RFC1, replication factor complex subunit 1; SARA, Scale for the Assessment and Rating of Ataxia.

