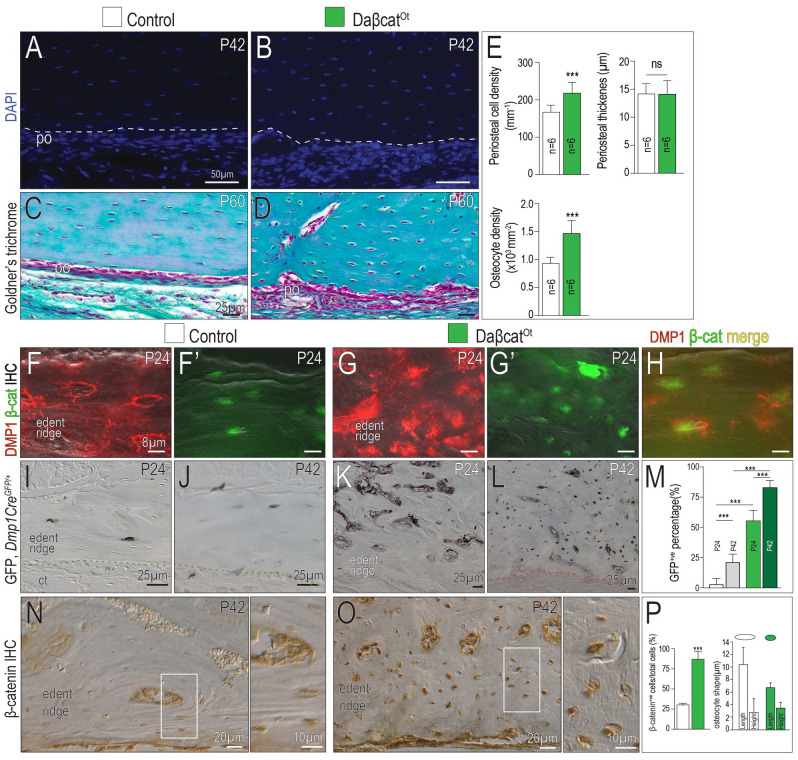
Figure 2.
Dmp1-expressing osteoblasts and osteocytes are increased in daβcatOt craniomaxillofacial (CMF) bones. Representative sagittal tissue sections of the maxillary edentulous ridge stained with DAPI from (A) control and (B) daβcatOt mice. Representative tissue sections stained with Goldner’s trichrome from (C) control and (D) daβcatOt mice. (E) Quantification of periosteal cell density, periosteal thickness, and osteocyte density. Coimmunostaining from (F) Dmp1 and (F′) β-catenin in controls. Coimmunostaining from (G) Dmp1 and (G′) β-catenin in daβcatOt mice. (H) Merged images of Dmp1 and β-catenin in daβcatOt CMF bone. Using Using Dmp1CreGFP/+ mice, immunostaining for GFP in (I) postnatal day 24 (P24) and (J) postnatal day 42 (P42) controls. GFP immunostaining in (K) P24 and (L) P42 daβcatOt mice. (M) Quantification of the percentage of GFP+ cells in a region of interest (ROI) from P24 and P42 controls (white and gray bars) and from P24 and P42 daβcatOt mutants (green bars). β-Catenin immunostaining on representative tissue sections from (N) P42 control and (O) daβcatOt mutant mice. (P) Quantification of β-catenin+ cells/total cells in a ROI and osteocyte shape, expressed as length and height of representative lacunae. Abbreviations as indicated in Fig. 1. ***P < 0.001.

