Figure 2.

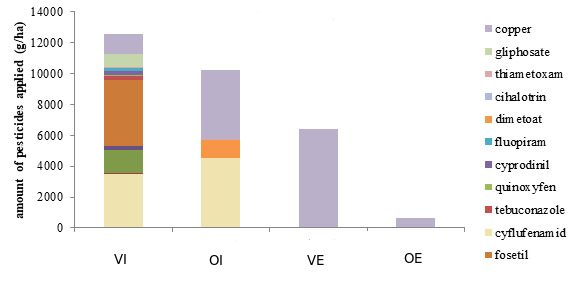
The amount of pesticides added at each study site during 2018, shown as grams of active substances applied per hectare. For site abbreviations, see Table 1.

The amount of pesticides added at each study site during 2018, shown as grams of active substances applied per hectare. For site abbreviations, see Table 1.