. 2023 Oct 24;14(2):362–379. doi: 10.1158/2159-8290.CD-23-0402

Figure 3.

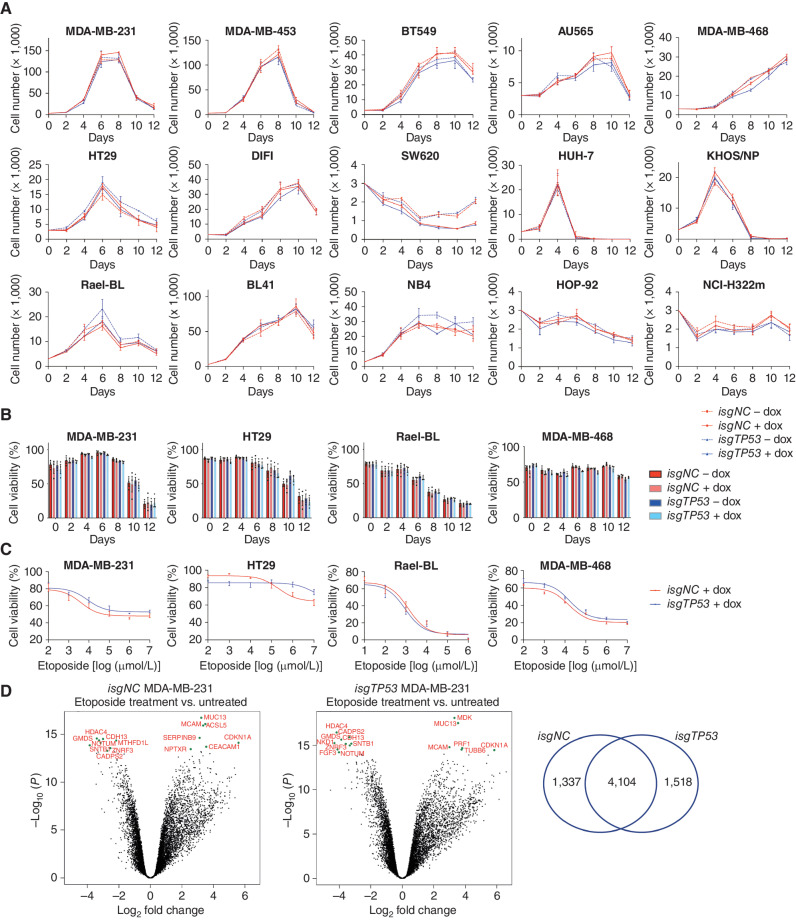
Figure 3. Removal of mutant TP53 does not impair the ability of cancer cells to adapt to conditions of stress. A, In vitro growth of the indicated human cancer cell lines with or without doxycycline-mediated induction of an inducible mutant TP53–specific sgRNA (isgTP53) or an inducible control sgRNA (isgNC) grown in medium with 1% FCS. B, In vitro survival of the cancer cells described in A. C, The viability of the cancer cells described in A after treatment with the indicated concentrations of etoposide for 48 hours. D, Volcano plots for the control mutant TP53–expressing MDA-MB-231 cells treated with etoposide versus treatment with vehicle (left) and for the mutant TP53–deleted derivatives treated with etoposide treatment versus treatment with vehicle (right). The x-axis shows the log2 fold change in gene expression whereas the y-axis shows −log10 (P). Significantly differentially expressed (DE) genes are those above −log10 (0.05) = 1.3 on the y-axis. The top 15 significantly DE genes are indicated by green dots. The Venn diagram shows that nearly 60% of DE genes after treatment with etoposide are the same between the control and the mutant TP53–deleted MDA-MB-231 cancer cells. Data in A–C are presented as mean ± SEM of three independent experiments. There were no consistent significant differences between the TP53-deleted cancer cells versus the control cancer cells in any of the experiments shown (see Supplementary Tables S1 and S2 for details of the statistical analyses).

Removal of mutant TP53 does not impair the ability of cancer cells to adapt to conditions of stress. A,In vitro growth of the indicated human cancer cell lines with or without doxycycline-mediated induction of an inducible mutant TP53–specific sgRNA (isgTP53) or an inducible control sgRNA (isgNC) grown in medium with 1% FCS. B,In vitro survival of the cancer cells described in A. C, The viability of the cancer cells described in A after treatment with the indicated concentrations of etoposide for 48 hours. D, Volcano plots for the control mutant TP53–expressing MDA-MB-231 cells treated with etoposide versus treatment with vehicle (left) and for the mutant TP53–deleted derivatives treated with etoposide treatment versus treatment with vehicle (right). The x-axis shows the log2 fold change in gene expression whereas the y-axis shows −log10 (P). Significantly differentially expressed (DE) genes are those above −log10 (0.05) = 1.3 on the y-axis. The top 15 significantly DE genes are indicated by green dots. The Venn diagram shows that nearly 60% of DE genes after treatment with etoposide are the same between the control and the mutant TP53–deleted MDA-MB-231 cancer cells. Data in AC are presented as mean ± SEM of three independent experiments. There were no consistent significant differences between the TP53-deleted cancer cells versus the control cancer cells in any of the experiments shown (see Supplementary Tables S1 and S2 for details of the statistical analyses).