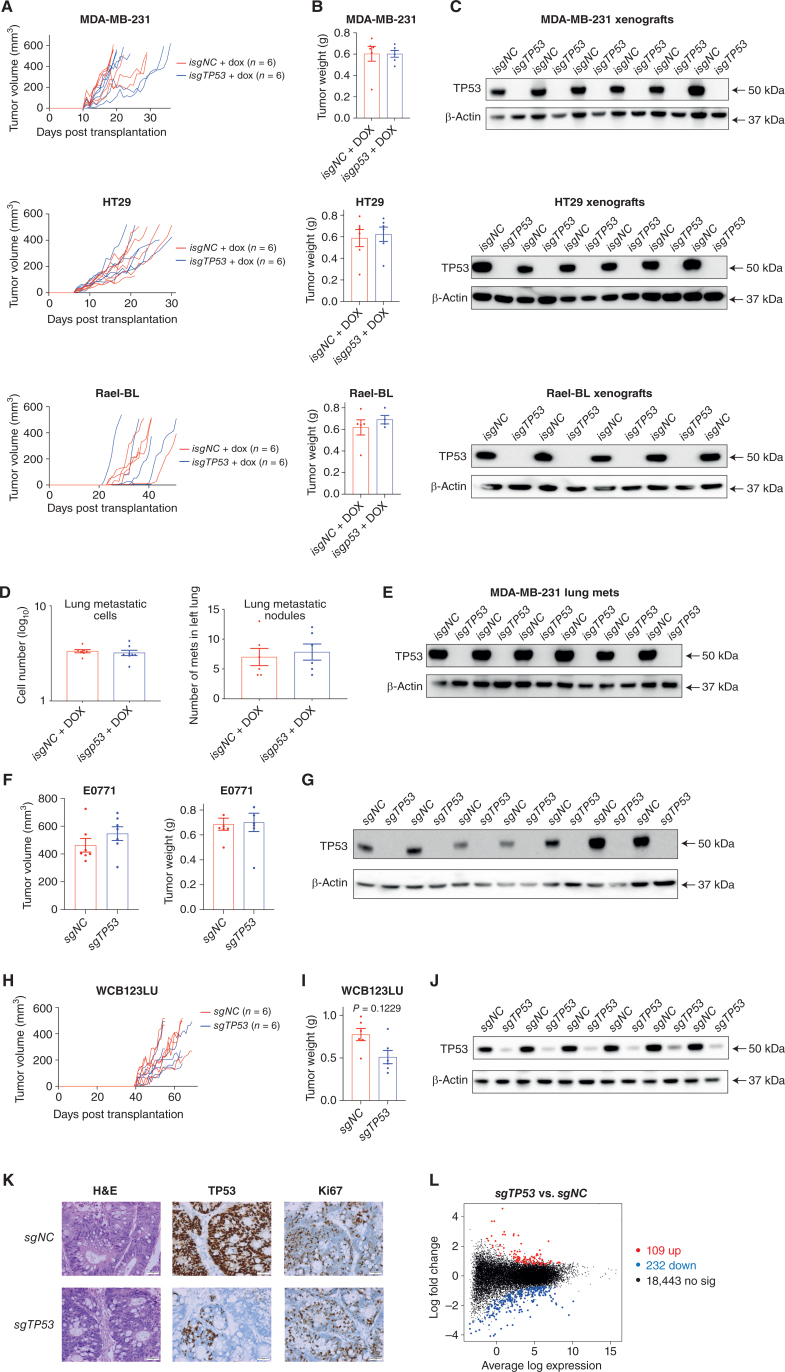
Figure 6.
Removal of mutant TP53 does not impair tumor growth and metastasis in vivo. A, Growth of the human cancer cell lines MDA-MB-231, SW620, and Rael-BL, either mutant TP53-expressing control cells or the mutant TP53-deleted derivatives, in NSG mice (N = 6 mice per cell line) with tumor volumes presented in mm3. B, Weights of the tumors from A at the ethical endpoint. C, Western blot analysis of the tumors from A to verify the presence of mutant TP53 protein in the control cancer cells and to confirm its absence in the tumors arising from the mutant TP53–deleted cancer cells. Probing for β-Actin was used as a protein loading control. D, Numbers of metastatic cells and nodules in the left lungs of NSG mice that had been injected with MDA-MB-231 breast cancer cells, either mutant TP53-expressing control cells or the mutant TP53-deleted derivatives, into their mammary fat pads (N = 6 mice for each cancer cell line). The primary breast tumors were resected when they had reached 200 mm3 to enable analysis of metastasis thereafter. E, Western blot analysis of the metastases from D to verify the presence or absence of mutant TP53, respectively. Probing for β-Actin was used as a protein loading control. F, Volume and weight of the primary tumors in immune-competent mice transplanted with EO771 mouse breast cancer cells, either mutant Trp53–expressing control cells or their mutant Trp53–deleted derivatives. The breast cancer cells were transplanted into mammary fat pads of Cas9 transgenic mice (C57BL/6 background) to prevent immune rejection caused by Cas9 expression. G, Western blot analysis of the tumors from F to verify the presence of mutant TRP53 in the control cells or its absence in the mutant Trp53–deleted derivatives. Probing for β-Actin was used as a protein loading control. H, Growth of the human colon cancer–derived organoids WCB123LU, either the mutant TP53–expressing controls or the mutant TP53–deleted derivatives, in NSG mice (n = 6 mice per organoid line) with tumor volume presented in mm3. I, Weights of the tumors from H at the ethical endpoint. J, Western blot analysis of the tumors from H to verify the presence of mutant TP53 in the tumors derived from the control organoids or its absence in the tumors derived from the mutant TP53–deleted derivatives. K, Hematoxylin and eosin staining and IHC of the tumors from H to verify the presence of mutant TP53 in the control tumors or its absence in the mutant TP53–deleted derivatives. IHC analysis of Ki-67 in the tumors from H to reveal the expression of this marker of cell proliferation in tumors derived from the control mutant TP53–expressing colon cancer organoids or their mutant TP53–deleted derivatives. Magnification, 200×. L, Mean difference plot for the RNA-seq differential gene expression analysis comparing tumors in NSG mice that had been derived from mutant TP53–expressing control WCB123LU colon cancer organoids with tumors in NSG mice derived from the mutant TP53–deleted derivatives. The x-axis shows the average gene log expression, whereas the y-axis shows gene log2 fold change. Points colored red and blue indicate genes that are significantly upregulated or downregulated, respectively, in the tumors derived from the mutant TP53–deleted colon cancer organoids compared with the mutant TP53–expressing control tumors. Data in B, D, and I are presented as mean ± SEM of results from experiments conducted in triplicate.

