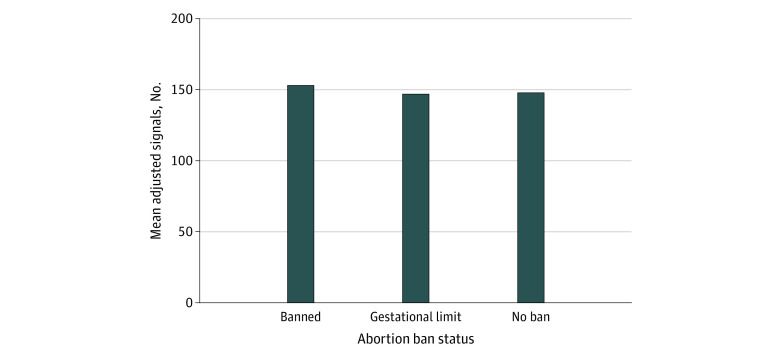
Figure 1. Mean Adjusted Number of Program Signals Received by Obstetrics and Gynecology Programs in States With Abortion Bans, Gestational Limits, and No Bans in the 2023 Match Cycle.
The mean adjusted number of program signals within each ban status category was computed after controlling for covariates (number of applications received and program size) through the least-squares means in the analysis of covariance model.

