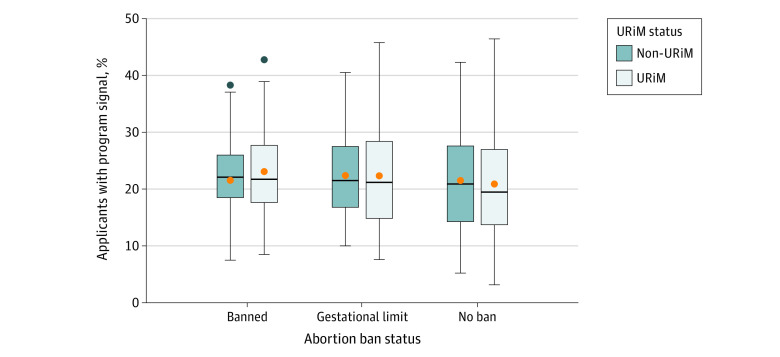
Figure 3. Percentage of Program Signals Sent to Obstetrics and Gynecology Programs in States With Abortion Bans, Gestational Limits, or No Bans in the 2023 Match Cycle, by Applicants’ Underrepresented in Medicine (URiM) Status.
The horizontal bar inside the boxes indicates the median percentage of applicants with program signals across programs (N = 283) and the lower and upper bounds of the boxes, the first and third quartiles. The whiskers indicate the largest values no further than 1.5 times the IQR from the ends of the boxes, and data more extreme than the whiskers are plotted individually as outliers (black dots). Orange dots indicate the mean percentage of applicants with program signals across programs.

