
Figure 1. Influence of the Time From Symptom Onset to Expected Administration of Intravenous Thrombolysis on the Benefit Associated With Intravenous Thrombolysis Plus Thrombectomy.
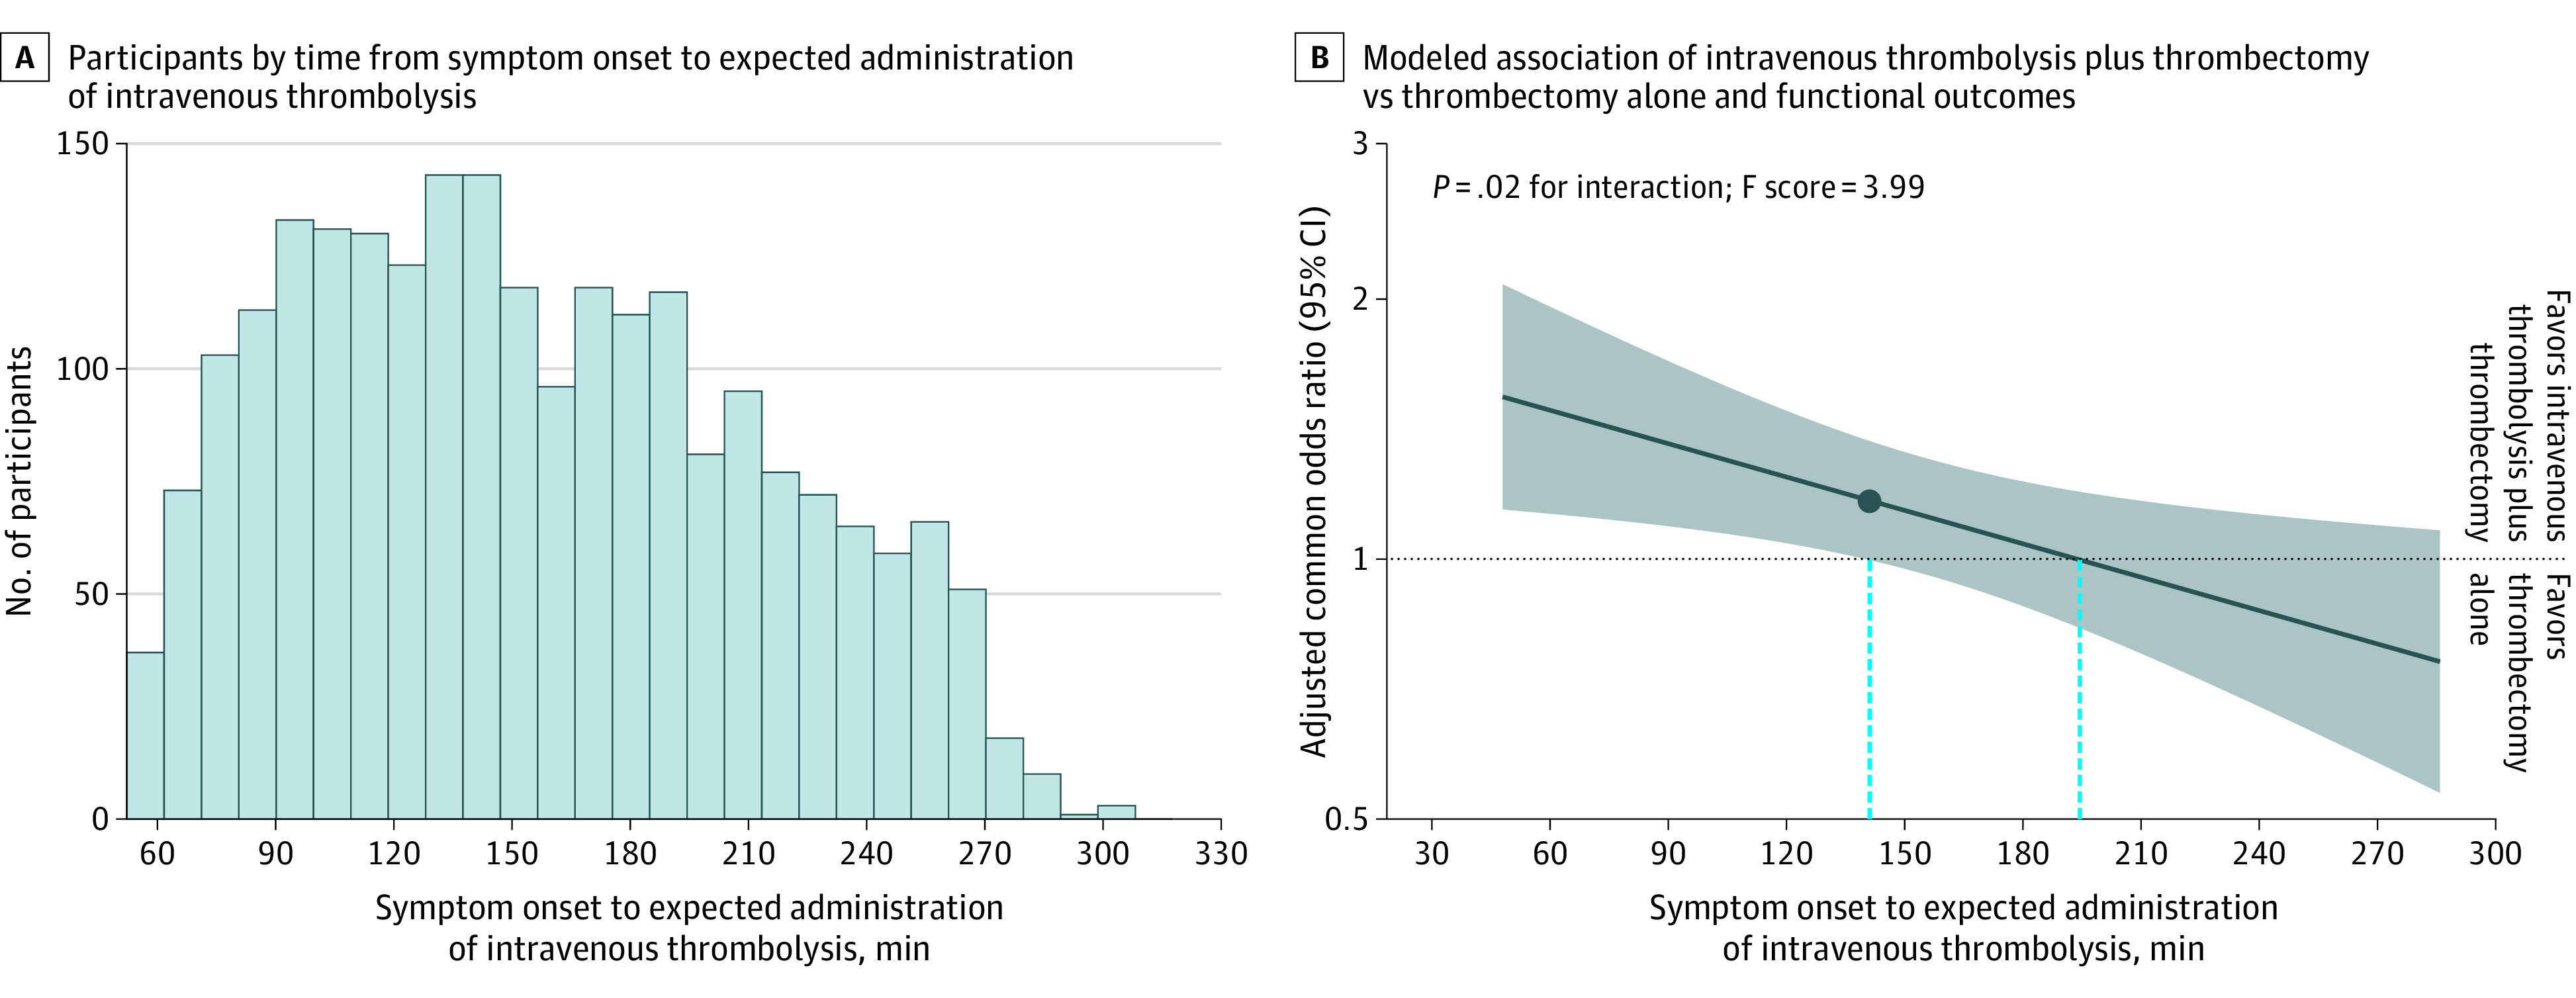
In A, there were 14 patients omitted from the graph (had symptom onset to expected administration of intravenous thrombolysis times of <45 minutes or >320 minutes). In B, the solid dark blue line indicates the best model fit of the log odds ratio for a favorable shift in the modified Rankin Scale scores at 90 days associated with intravenous thrombolysis plus thrombectomy vs thrombectomy alone and treatment delay between symptom onset to expected administration of intravenous thrombolysis. The shaded area reflects the 95% CI for the adjusted common odds ratio. An adjusted common odds ratio greater than 1 indicates better outcomes (favorable shifts in the modified Rankin Scale scores) associated with treatment with intravenous thrombolysis plus thrombectomy. The dashed blue lines indicate the time points at which the lower bound of the 95% CI and the point estimate crossed 1.0.