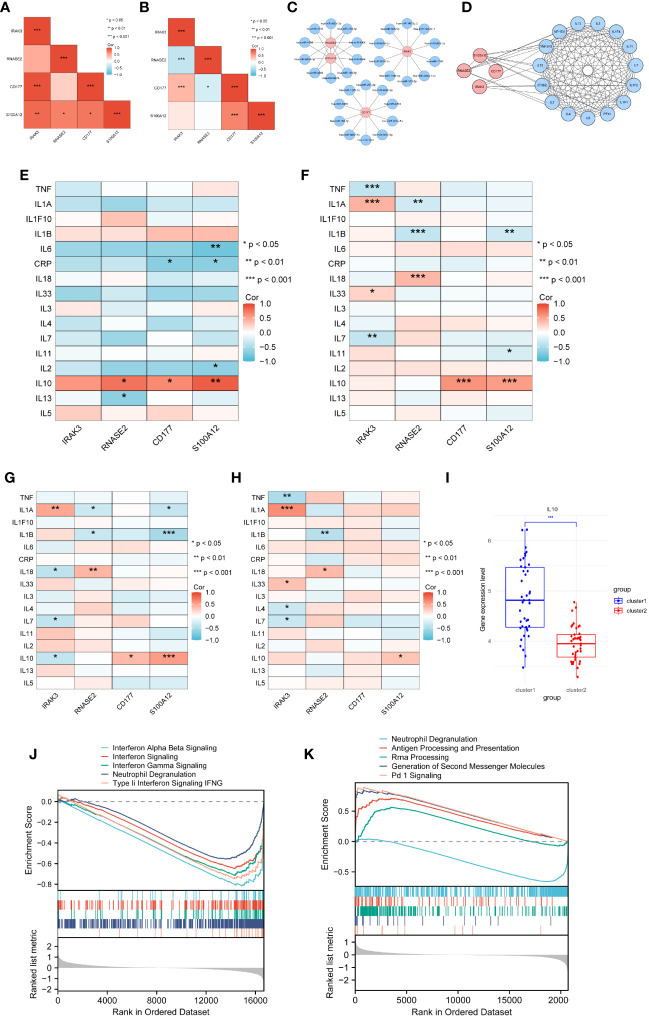
Figure 9.
Selection of target proteins. (A) Correlation among diagnostic genes based on GSE29161. (B) Correlation among diagnostic genes based on GSE57065. (C) mRNA-miRNA network. (D) PPI network for diagnostic genes and inflammatory cytokines. (E) Correlation between diagnostic genes and inflammatory cytokines in GSE29161. (F) Correlation between diagnostic genes and inflammatory cytokines in sepsis samples from GSE5706. (G–H) Correlation between diagnostic genes and inflammatory cytokines in sepsis clusters sample(G-sepsis cluster1,H- sepsis cluster2). (I) Expression levels of IL10 for sepsis clusters samples. (J) GSEA analysis of GSE29161. (K) GSEA analysis of GSE57065. * P<0.05, ** P<0.01, *** P<0.001, ns: not significance.

