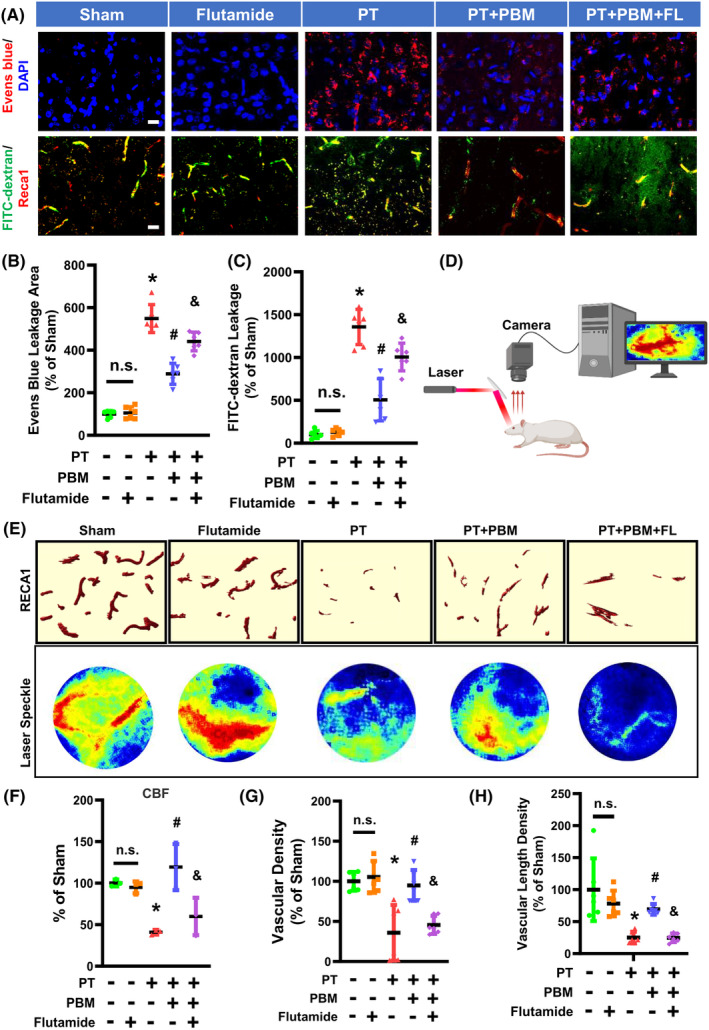
FIGURE 2.

Flutamide inhibits the improvement in blood‐brain barrier (BBB) permeability, vascular morphometric parameters, and cerebral blood flow (CBF) induced by PBMT in the peri‐infarct region of PT‐stroke rats. (A) Representative fluorescence images of Evans blue (red), FITC‐dextran (green), and Reca1 (red) in the peri‐infarct zone. Nuclei were counterstained with DAPI (blue). (B, C) Quantitative analysis of extravascular Evans blue and FITC fluorescence intensity was performed using ImageJ software. (D) A schematic of the laser speckle contrast imaging system. (E) Representative 3D reconstruction (Bitplane Imaris software) of Reca1 staining and flux images of cortical vasculature in the peri‐infarct regions are shown. (F) Changes in CBF were calculated as percentage changes relative to Sham group. (G) Quantitative analysis of vascular density was shown as percentage change relative to Sham group. (H) Quantitative analysis of vascular length density was performed as percentage change relative to Sham. All data are expressed as mean ± SD (n = 5–6). One‐way ANOVA followed by post hoc Bonferroni's test was used for analysis. * indicates p < 0.05 vs. Sham group; # indicates p < 0.05 vs. PT‐stroke group; & indicates p < 0.05 vs. PT + PBM group. “n.s.” indicates no significant difference (p > 0.05). FL, flutamide. Scale bar = 20 μm.
