
FIGURE 4.
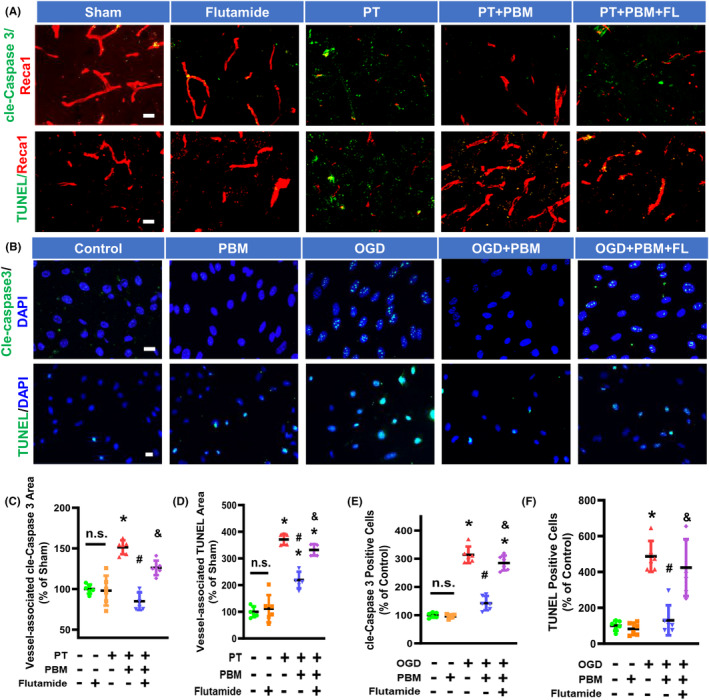
Flutamide reverses PBMT‐mediated inhibition of vessel‐associated cle‐Caspase 3 and TUNEL in PT‐stroke and OGD‐treated bEND.3 cells. (A) Representative immunofluorescence images of cle‐Caspase 3 (green) and Reca1 (red), and TUNEL staining (green) in the peri‐infarct brain areas. (B) Representative fluorescence images for cle‐Caspase 3 (green), TUNEL (green), and DAPI (blue). (C, D) Quantitative analysis of vessel‐associated cle‐Caspase 3 and TUNEL were performed using ImageJ software (n = 5–6 per group). (E, F) Quantitative analysis of the percentage of cell with cle‐Caspase 3‐positive nuclei and TUNEL‐positive nuclei were performed using ImageJ software in bEND.3 cells (n = 5–6). All data are expressed as mean ± SD. One‐way ANOVA followed by post hoc Bonferroni's test was used for analysis. * indicates p < 0.05 vs. Sham or Control group; # indicates p < 0.05 vs. PT‐stroke or OGD group; & indicates p < 0.05 vs. PT + PBM or OGD + PBM group. “n.s.” indicates no significant difference (p > 0.05). FL, flutamide; OGD, Oxygen‐glucose deprivation. Scale bar for tissue = 20 μm. Scale bar for cells = 10 μm.