FIGURE 6.

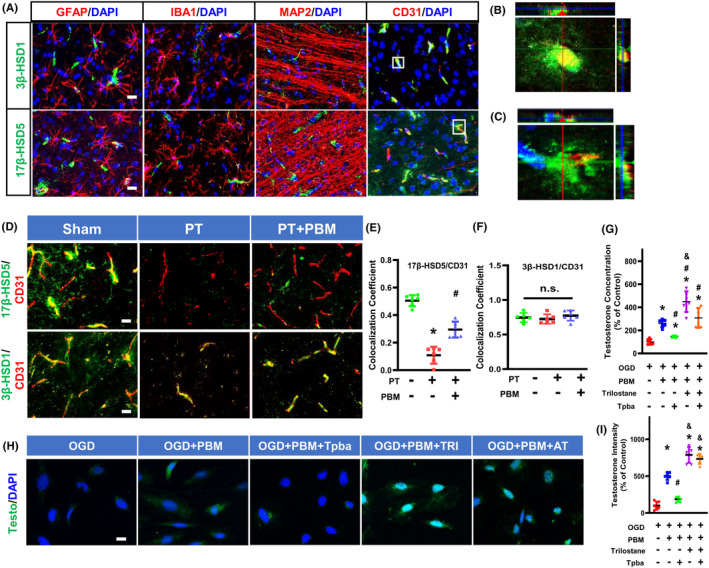
Expression of 3β‐HSD1 and 17β‐HSD5 in the rat brain, and the effects of 3β‐HSD1/17β‐HSD5 inhibitors on PBMT‐induced testosterone production. (A) Representative immunofluorescence staining images of 17β‐HSD5 (green), 3β‐HSD1 (green), GFAP, IBA1, MAP2, and CD31 in normal animal brains. Nuclei were counterstained with DAPI. (B) Orthogonal images of 3β‐HSD1 (green)/CD31 (red) are represented in the x‐z and y‐z directions. (C) Orthogonal images of 17β‐HSD5 (green)/CD31 (red) are represented in the x‐z and y‐z directions. (D) Representative immunofluorescence staining images of 3β‐HSD1 (green), 17β‐HSD5 (green) and CD31 (red) in the peri‐infarct area. (E, F) Quantitative analysis of colocalization of 3β‐HSD1 or 17β‐HSD5 with CD31 in peri‐infarct area of rat brain (n = 5–6). (G) Testosterone concentration was measured by ELISA after treatment with 25 μM Trilostane or 10 μM Tpba. (H) Representative immunofluorescence staining images of Testosterone (testo) and DAPI after treatment with Trilostane or Tpba. (I) Quantitative analysis of testosterone immunointensity in bEND.3 cells. All data are expressed as mean ± SD (n = 6). One‐way ANOVA followed by post hoc Bonferroni's test was used for analysis. Scale bar for tissue = 20 μm. Scale bar for cells = 10 μm. Testo, Testosterone; AT, Tpba and Trilostane; TRI, Trilostane; OGD, Oxygen‐glucose deprivation. * indicates p < 0.05 vs. Sham or Control group; # indicates p < 0.05 vs. PT stroke group or OGD group; & indicates p < 0.05 vs. PT + PBM group or OGD + PBM group or OGD + PBM + AI group. “n.s.” indicates no significant difference (p > 0.05).
