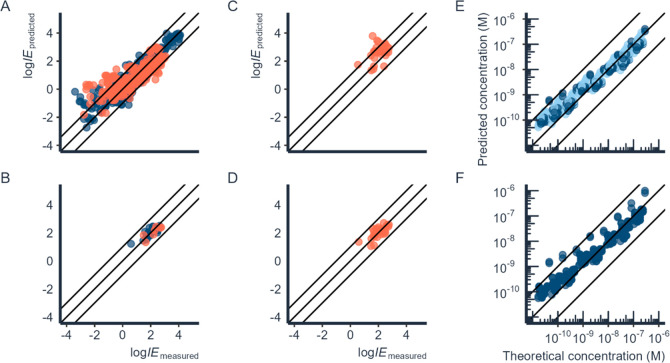
Figure 3.
Training (dark blue) and test (orange) sets of the ESI negative mode prediction model for A) non-PFAS chemicals and B) PFASs. The correlation plots for experimental log IE values for PFASs compared to C) predicted log IE values using a model without added PFASs and D) predicted log IE values obtained from the leave-one-out approach. The correlation between spiked concentrations and E) concentration estimations using the response factor of a homologue chemical that is one −CF2– unit smaller (light blue) or larger (dark blue) compared to the respective suspect and F) concentration estimations using predicted ionization efficiency for the same set of chemicals with a leave-one-out approach.

