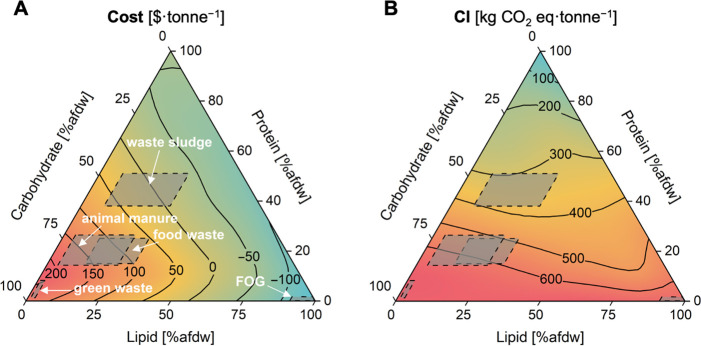
Figure 3.
Waste management (A) cost and (B) carbon intensity (CI) for all combinations of biochemical compositions. A total of 66 biochemical compositions were simulated, with the median value of 1000 Monte Carlo simulations shown in the figure. A constant moisture content (80%) and a constant ash content (15%, on a dry weight basis) were assumed for each biochemical composition. Carbohydrate, lipid, and protein are reported on an ash-free dry weight basis. The biochemical compositions for each representative feedstock were (sludge) 8% to 30.8% lipid and 38 to 51% protein,22,76−78 (FOG) 91.2% to 100% lipid and 0% to 1.2% protein,72 (food waste) 13% to 30% lipid and 15% to 25% protein,72 (green waste) 1.0% to 2.6% lipid and 1.6% to 8.2% protein,74,75 and (animal manure) 3.8% to 24.7% lipid and 14.3% to 26.4% protein.22,91 For all feedstocks, carbohydrate was calculated as 100%–lipid%–protein%.

