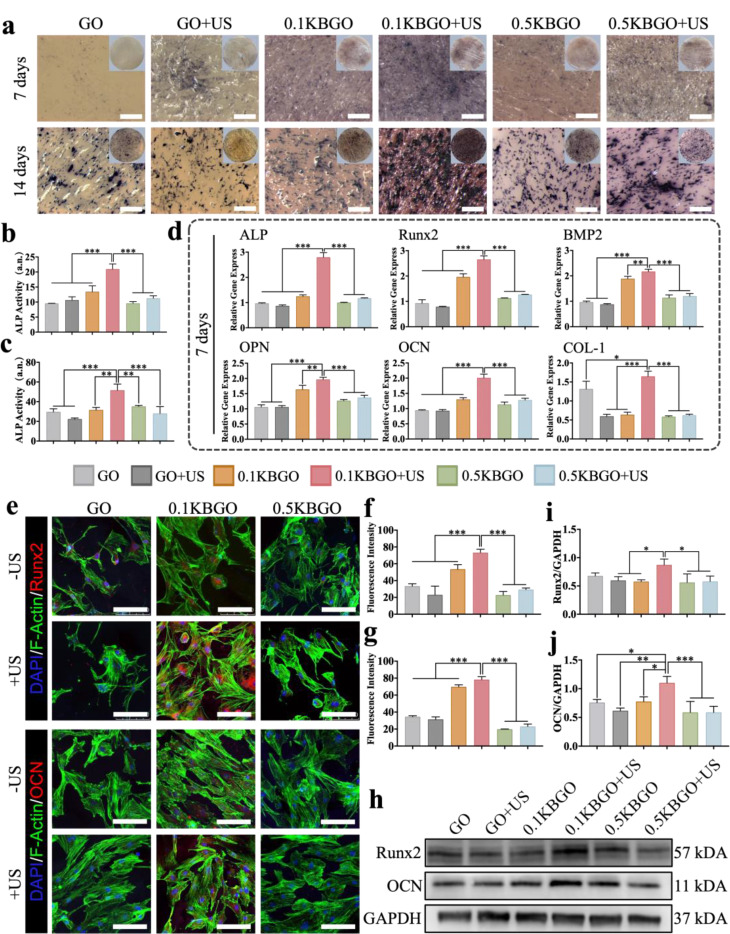
Fig. 4.
In vitro osteogenic differentiation of BMSCs on ultrasound-powered hydrogel surfaces. (a) ALP staining of BMSCs incubated on each hydrogel surface for 7 and 14 days. Scale bar represents 500 μm. (b, c) Quantitative analysis of ALP staining for 7 and 14 days (n = 3). (d) The expression levels of osteogenic genes (ALP, Runx2, BMP2, OPN, OCN, and COL-I) of BMSCs cultured on different samples on day 7 (n = 3). (e) Immunofluorescent staining of osteogenesis-related protein Runx2 and OCN (red), cytoskeleton (green), and nuclei (blue) of BMSCs cultured on each hydrogel for 7 days. Scale bar represents 100 μm. (f, g) Quantitative analysis of fluorescence intensity of Runx2 and OCN (n = 3). (h) Western blot assay of Runx2 and OCN of BMSCs on day 7. (i, j) Quantitative analysis of protein band intensities (n = 3). ANOVA followed by Tukey’s post hoc test was performed for statistical analysis (*p < 0.05, **p < 0.01, ***p < 0.001)

