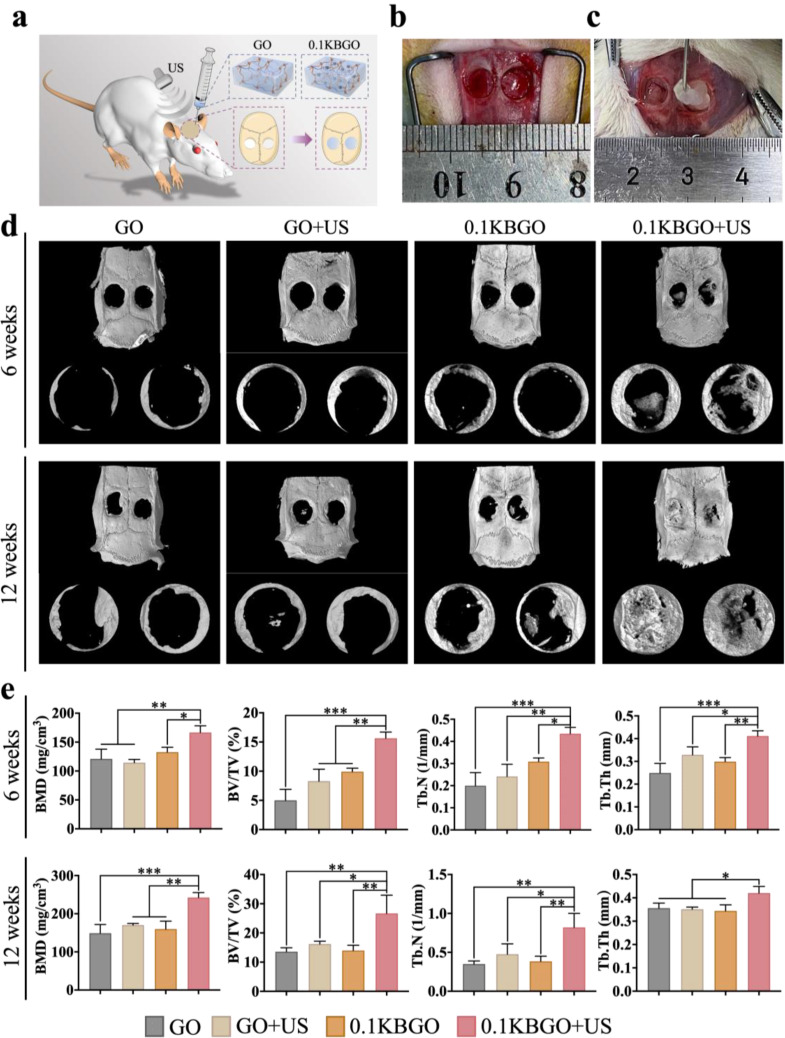
Fig. 5.
In vivo new bone regeneration of rat critical-size calvarial defects in different groups. (a) Schematic illustration of the rat critical-size calvarial defects (d = 5 mm) surgical procedure and different treatments. (b, c) Optical photos of the implantation of the injectable GO and 0.1KBGO hydrogels into the 5 mm rat calvarial defects. (d) Micro-CT images showing cross-sectional bone regeneration in different groups at weeks 6 and 12 postoperatively. (e) Quantitative analysis of bone regeneration within ROI at weeks 6 and 12 (n = 3). ANOVA followed by Tukey’s post hoc test was performed for statistical analysis (*p < 0.05, **p < 0.01, ***p < 0.001)

