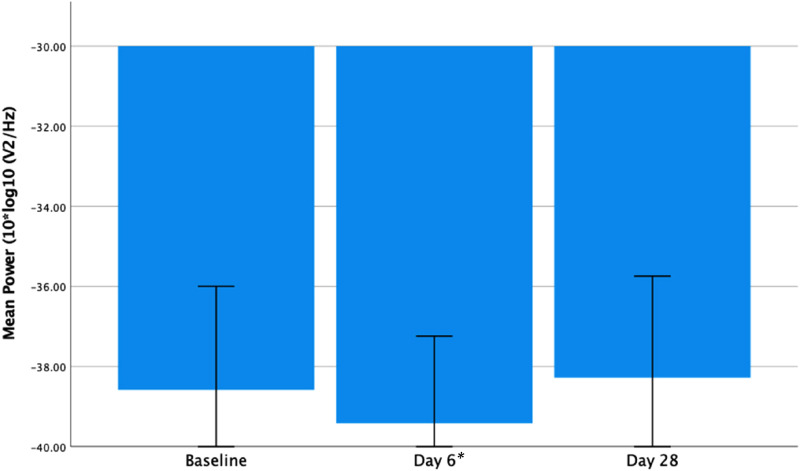
Figure 4.
Frontal resting gamma power (10 × log10 (μV2/Hz)) at baseline, days 6 and 28 in the PBO group. Showing a significant reduction from baseline to day 6 (t7 = 2.626, P = .035) and non-significant increase from baseline to day 28 (t7 = −0.564, P = .591). Error bars = 95% confidence intervals. *P < .05.

