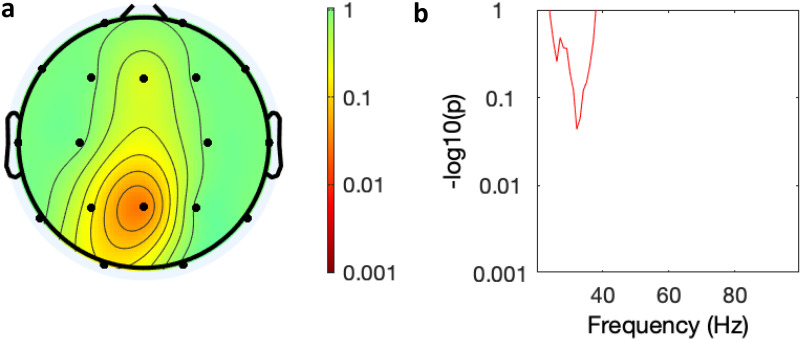
Figure 5.
Spectral analysis of the effect of time on power in the AUT00206 group. (a) Topology of average power change across all leads over time (baseline, days 6 and 28), (colour bar = P-value Bonferroni corrected); (b) graphical display of effect of time on power over frequency in the Fz lead (y axis = P-value Bonferroni corrected).

