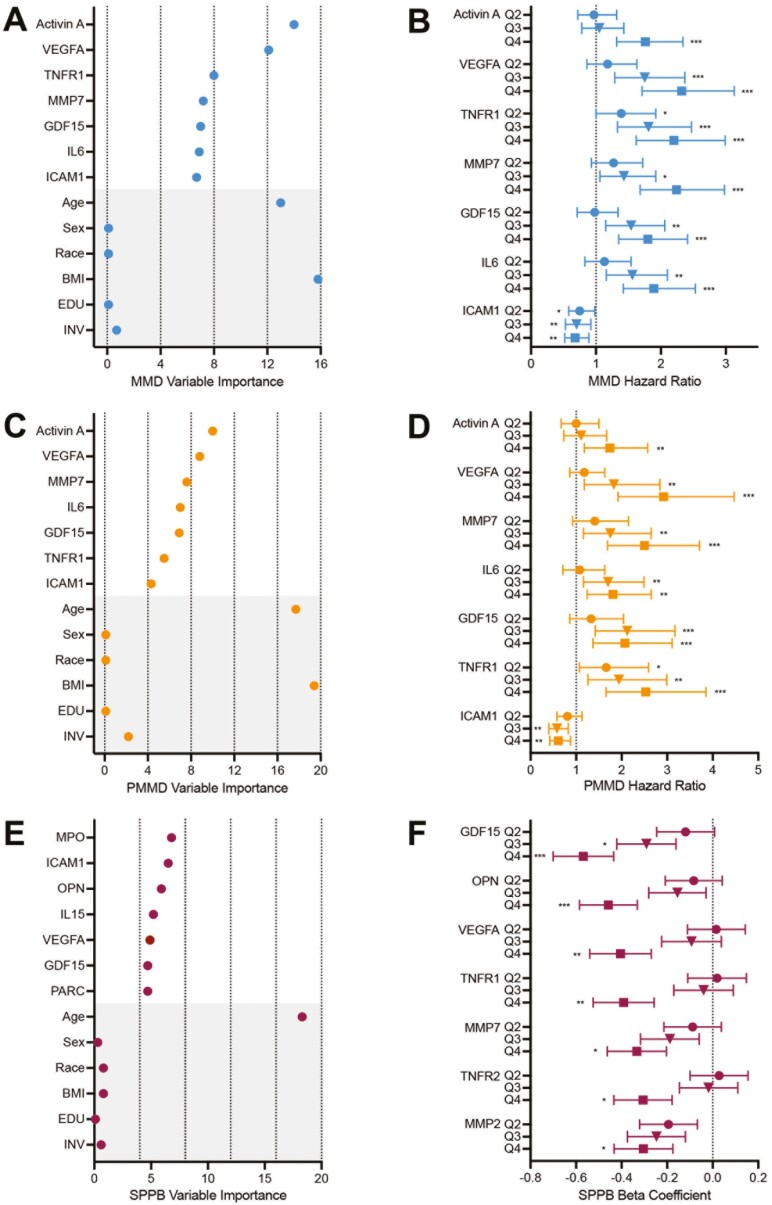
Figure 2.
Biomarkers of cellular senescence identify risk for onset of incident and persistent mobility disability, and change in short physical performance battery. The top 7 biomarkers along with age (years), sex (female, male), race (White, Black or African American, Hispanic, Asian, or Other), body mass index (BMI; kg/m2), education (EDU; high school or less, or college or more), and intervention assignment (INV; physical activity, or health education) selected by gradient boost modeling for: (A) onset of incident mobility disability (MMD) and (C) onset of persistent major mobility disability (PMMD) over the entire study period, and (E) change in short physical performance battery (SPPB) score at 6 months. Quartiles of the top 7 biomarker concentrations at baseline and association with: (B) onset of incident mobility disability compared to quartile 1, (D) onset of persistent mobility disability, (F) change in SPPB score. *p < .05; **p < .01; ***p < .001 compared to quartile 1. All models were adjusted for intervention, age, sex, BMI, education, and race and stratified by clinical site.

