Figure 3.
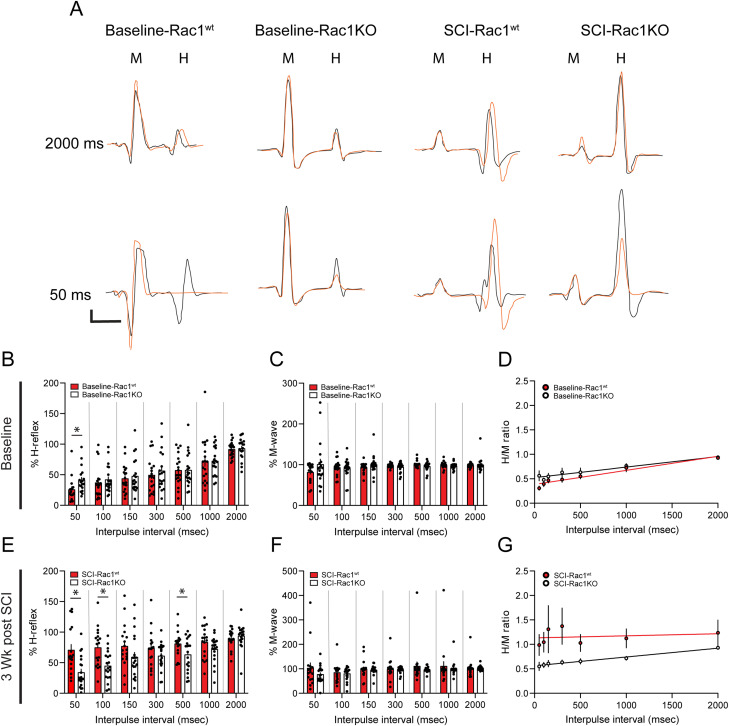
Knockout of Rac1 in astrocytes prevented the development of hyperreflexia after SCI. Representative control (black line) and test (orange line) traces of evoked H-reflex and M-wave responses in A baseline-Rac1wt, baseline-Rac1KO, SCI-Rac1wt, and SCI-Rac1KO. The control and test pulses were separated with a range of interpulse latencies between 50 and 2,000 ms. B–D, Comparison of %H-reflex, %M-wave, and H/M ratio between Rac1wt and Rac1KO at baseline, prior to receiving spinal cord injury. B, As expected at baseline in Rac1wt animals, at shorter interpulse intervals (e.g., 50 ms), the amplitude of the test pulse H-reflex was reduced. B, At baseline, Rac1KO animals displayed a slight increase in the %H-reflex at the 50 ms interval compared to Rac1wt animals (*p < 0.05). C, There was no difference in %M-wave between Rac1wt and Rac1KO groups at baseline. D, In addition, there was no difference in the H/M ratio between Rac1wt and Rac1KO. Rac1wt and Rac1KO animals had similar H/M ratios across all interpulse intervals, demonstrating RDD in both groups. E–G, Comparison of %H-reflex, %M-wave, and H/M ratio between Rac1wt and Rac1KO 3-weeks post-SCI. E, After SCI, Rac1wt animals have an exaggerated %H-reflex at 50 and 100 ms interpulse intervals, indicative of hyperreflexia. Rac1KO in astrocytes restored %H-reflex to levels similar to baseline (*p < 0.05). F, There was no difference in %M-wave amplitude between Rac1wt, Rac1KO, and baseline. G, SCI increased the H/M ratio as demonstrated as a flat linear trend line compared to a closer-to-normal H/M ratio, with a steeper linear trend line in Rac1KO and baseline groups. Note that in Figure 3G,K, the interpulse interval is graphed as a linear scale, to reflect the linear regression analysis (*p < 0.05). Scale bars in A–D = 2 ms (x-axis) and 0.1 spike volts (y-axis), n = 19–20 per group, and graphs are mean ± SEM.

