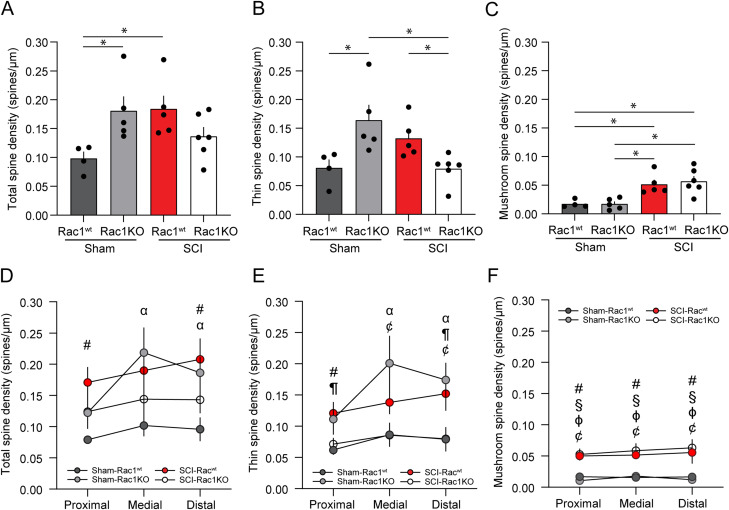
Figure 5.
Following SCI, Rac1KO in astrocytes reduces thin, but not mushroom, spine density. Analysis of dendritic spine profiles reveals differences in A–C spine density and D–F distribution along the dendrite. A, Total spine density, which encompasses all spine types, was increased in SCI-Rac1wt compared to Sham-Rac1wt (*p < 0.05). Total spine density was elevated in Sham-Rac1KO compared to Sham-Rac1wt (*p < 0.05). B, Sham-Rac1KO displayed significantly higher thin spine density compared to Sham-Rac1wt (*p < 0.05). Thin spine density on spinal motor neurons was lower in SCI-Rac1KO animals compared to SCI-Rac1wt (*p < 0.05). SCI-Rac1KO animals displayed less thin density compared to Sham-Rac1KO (*p < 0.05). C, There was no difference in the density of mushroom-shaped spine between Sham-Rac1wt and Sham-Rac1KO. Both SCI-Rac1wt and SCI-Rac1KO groups showed significantly higher mushroom spine density compared to Sham and Sham-Rac1KO (*p < 0.05). However, SCI-Rac1KO was not different from SCI-Rac1wt. Analysis of (D) total, (E) thin, and (F) mushroom spine density within the proximal (0–40 µm), medial (40–80 µm), and distal (80–120 µm) regions from the cell body. D, SCI increased the total spine density in the proximal region compared to Sham-Rac1wt (#p < 0.05, SCI-Rac1wt vs Sham-Rac1wt). Sham-Rac1KO displayed increased total spine density in the medial and distal region compared to Sham-Rac1wt (αp < 0.05, Sham-Rac1wt vs Sham-Rac1KO). E, SCI increased thin spine density in the proximal region compared to Sham-Rac1wt (#p < 0.05, SCI-Rac1wt vs Sham-Rac1wt). Rac1KO reduced thin spine density in the proximal to the cell body compared to SCI-Rac1wt (¶p < 0.05, SCI-Rac1wt vs SCI-Rac1KO). Sham-Rac1KO increased thin spine density in the medial and distal region compared to Sham-Rac1wt (αp < 0.05, Sham-Rac1wt vs Sham-Rac1KO). SCI-Rac1KO animals had a lower thin spine density compared to Sham-Rac1KO within the medial and distal regions (¢p < 0.05, Sham-Rac1KO vs SCI-Rac1KO). F, SCI led to increased mushroom spine density in all regions in both Rac1wt and Rac1KO groups compared to both Sham groups (#p < 0.05, SCI-Rac1wt vs Sham-Rac1wt; §p < 0.05, SCI-Rac1KO vs Sham-Rac1wt; ɸp < 0.05, SCI-Rac1wt vs Sham-Rac1KO; ¢p < 0.05, Sham-Rac1KO vs SCI-Rac1KO). n = 4–6 animals per group, and graphs are mean ± SEM.

