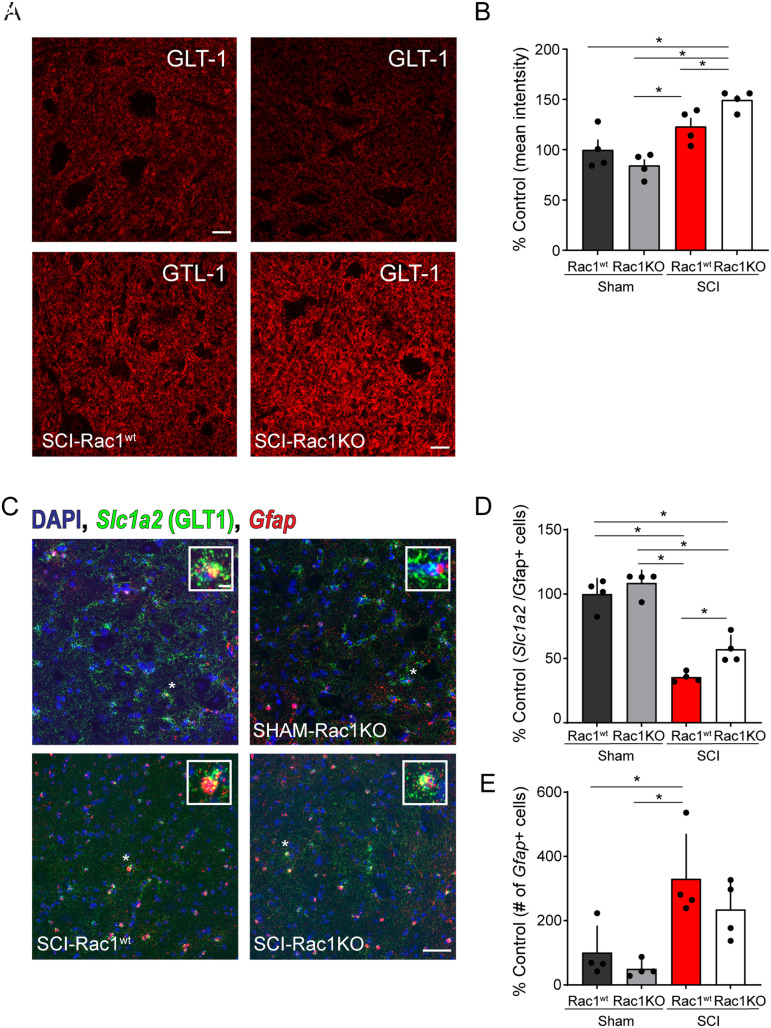
Figure 6.
Rac1KO alters the expression of the glutamate transporter GLT-1 in the ventral spinal cord gray matter. Antibody labeling for GLT-1 (A) in the ventral horn of the spinal cord in Sham-Rac1wt, Sham-Rac1KO, SCI-Rac1wt, and SCI-Rac1KO. B, The expression of GLT-1 (astrocytic glutamate transporter) as a percentage of control (Sham-Rac1wt) levels. The expression of GLT-1 was higher in SCI-Rac1KO compared to both SCI-Rac1wt, Sham-Rac1wt, and Sham-Rac1KO (*p < 0.05). There was no difference in GLT-1 expression between Sham-Rac1wt and Sham-Rac1KO. C, Fluorescent in situ hybridization (RNAscope) of Gfap and Slc1A2 (GLT-1) mRNA in the ventral horn of the spinal cord in Sham-Rac1wt, Sham-Rac1KO, SCI-Rac1wt, and SCI-Rac1KO. Inset images are representative of a single Gfap+ nucleus. D, The expression of Slc1a2 fluorescent puncta (i.e., mRNA transcripts) in Gfap+ nuclei in the ventral spinal cord compared between groups as a percentage of control (Sham-Rac1wt) levels. SCI reduces the expression of Slc1a2 mRNA compared to both Sham-Rac1wt and Sham-Rac1KO. However, Rac1KO animals with SCI displayed higher levels of Slc1a2 compared to SCI-Rac1wt controls. E, Total number of Gfap+ nuclei normalized to the total number of nuclei within the ventral horn of the spinal cord compared as a percentage of control (Sham-Rac1wt) levels. SCI induced an increase in the number of Gfap+ nuclei compared to the Sham control. In addition, there was no difference in Gfap+ nuclei between SCI-Rac1wt and SCI-Rac1KO. Scale bar in A = 10 µm and applies to images in A, scale bar in C = 50 µm and applies to images in C, scale bar in C inset = 5 µm and applies to all inset images in C. n = 4 per group, and graphs are mean ± SEM (*p < 0.05).

