
Fig. 3: Regional specificity of cell types correlates with chromatin accessibility.
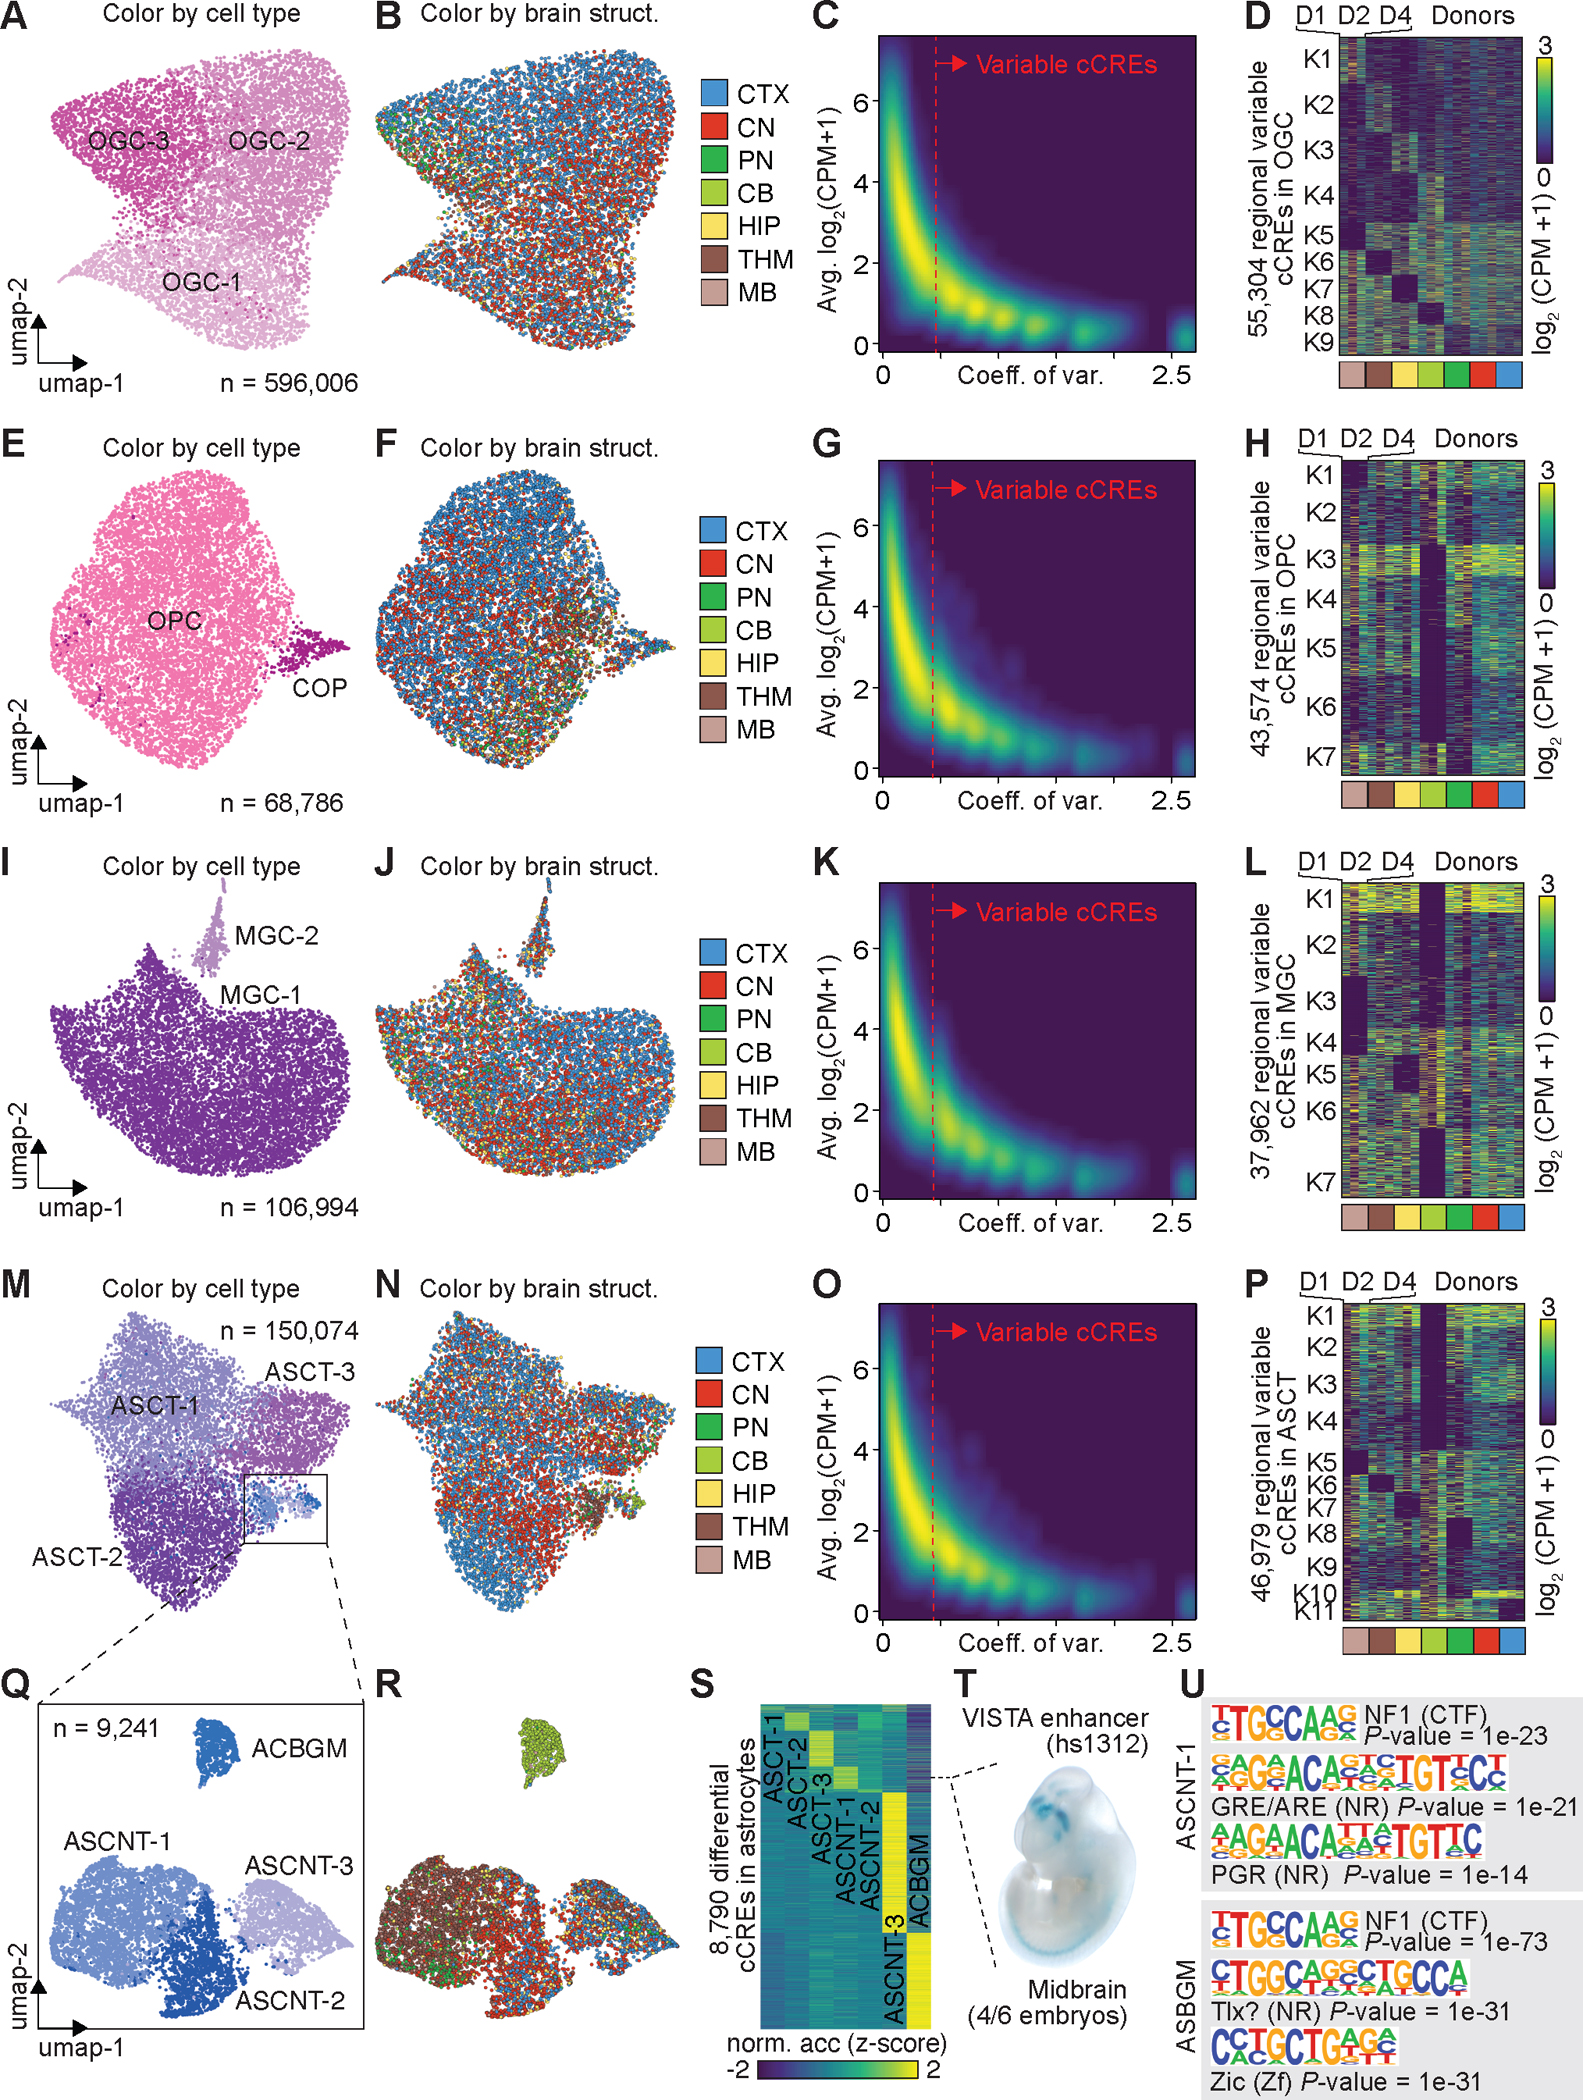
(A) UMAP embedding of cell types of oligodendrocytes (OGCs). (B) UMAP embedding of oligodendrocytes, colored by major brain structures. CTX, cortex; CN, cerebral nuclei; PN, Pons; CB, cerebellum; HIP, hippocampus; THM, thalamus; MB, midbrain. (C) Density scatter plot comparing the averaged accessibility and coefficient of variation across brain structures at each cCRE. Variable cCREs for OGCs are defined on the right side of dash line. (D) Heat map showing the normalized accessibility of variable cCREs in OGCs across major brain structures. CPM, counts per million. (E) UMAP embedding of cell types of oligodendrocyte precursor cells (OPCs). (F) UMAP embedding of OPCs, colored by major brain structures. (G) Density scatter plot comparing the averaged accessibility and coefficient of variation across brain structures at each cCRE. Variable cCREs for OPCs are defined on the right side of dash line. (H) Heat map showing the normalized accessibility of variable cCREs in OPCs. (I) UMAP embedding of cell types of microglia (MGC). (J) UMAP embedding of MGC, colored by major brain structures. (K) Density scatter plot comparing the averaged accessibility and coefficient of variation across brain structures at each cCRE. Variable cCREs for MGC are defined on the right side of dash line. (L) Heat map showing the normalized accessibility of variable cCREs in MGC. (M) UMAP embedding of cell types of astrocytes (ASCs). (N) UMAP embedding of ASCs, colored by major brain structures. (O) Density scatter plot comparing the averaged accessibility and coefficient of variation across brain structures at each cCRE. Variable cCREs for ASCs are defined on the right side of dash line. (P) Heat map showing the normalized accessibility of variable cCREs in ASCs. (Q) UMAP embedding of non-telencephalon ASCs (ASCNTs). (R) UMAP of ASCNTs, colored by major brain structures. (S) Normalized chromatin accessibility of 8,790 cell-type-specific cCREs. (T) Representative images of transgenic mouse embryos showing LacZ reporter gene expression under the control of the indicated enhancers that overlapped the differential cCRE in S (dotted line). Images were downloaded from the VISTA database (https://enhancer.lbl.gov). (U) Top enriched known motifs for astrocyte cell-type-specific cCREs.