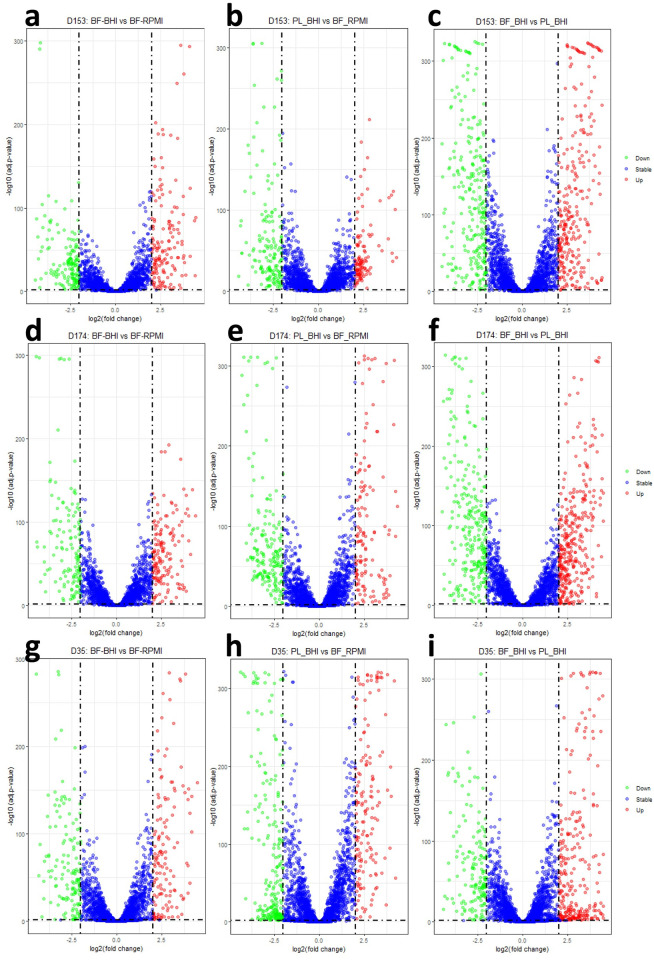
Fig 2. Volcano plot of log10 (adjusted p-value) vs. log2 fold change shows differentially expressed genes (DEGs) between two groups in each serotype.
D153 (St 1) (a); biofilm associated cells in BHI vs RPMI (b); biofilm associated cells in RPMI vs planktonic cells in BHI (c); planktonic cells vs biofilm associated cells in BHI. D174 (St 6) (d); biofilm associated cells in BHI vs RPMI (e); biofilm associated cells in RPMI vs planktonic cells in BHI (f); planktonic cells vs biofilm associated cells in BHI. D35 (St 2). (g); biofilm associated cells in BHI vs RPMI (h); biofilm associated cells in RPMI vs planktonic cells in BHI (i); planktonic cells vs biofilm associated cells in BHI. Green dots = down DEGs; blue dots = stable DEGs; red dot = up DEGs.

