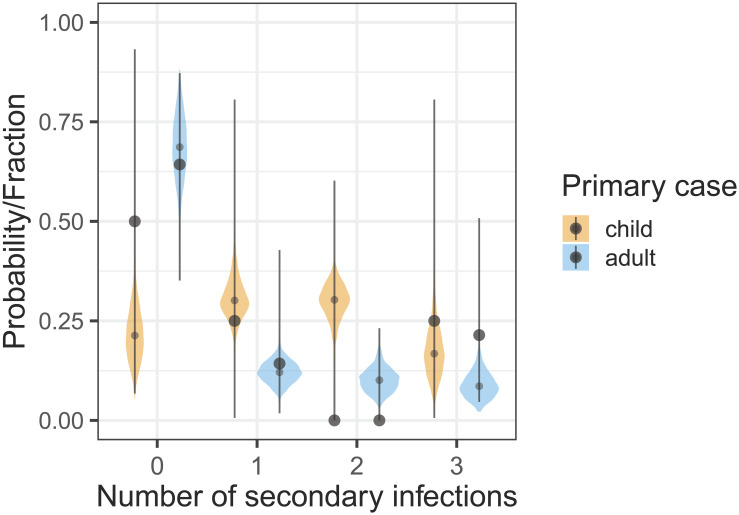
Fig 4. Posterior predictive checks in common households of size four, containing two adults and two children (cf. Table 1).
Shown are the fractions of the households with a given number of secondary infections (black dots) with exact binomial confidence ranges (lines) stratified by primary case (child or adult), together with the corresponding posterior probabilities of secondary cases.

