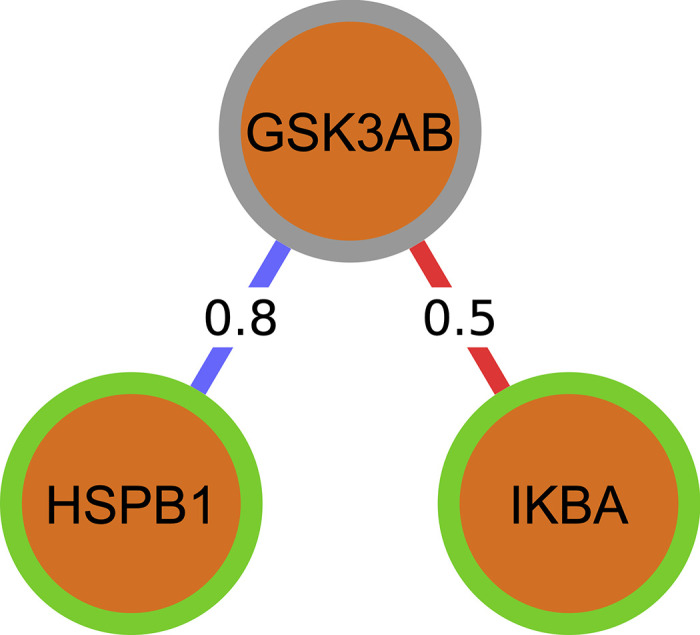
Fig 15. Depiction of summing weights to determine next activation state in Boolean simulations.

A green border represents an active node, and a gray border represents an inactive one.

A green border represents an active node, and a gray border represents an inactive one.