
Figure 3.
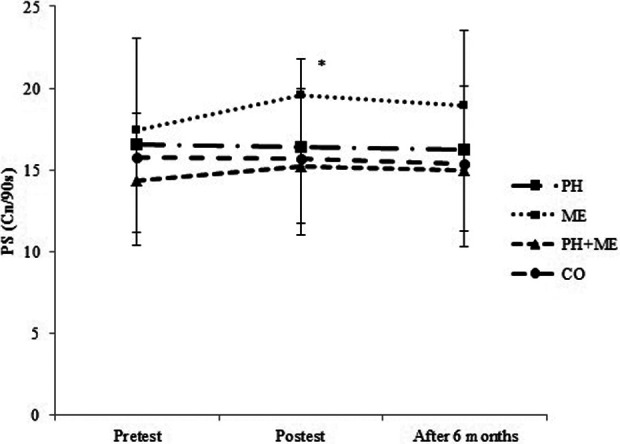
Mean and standard deviation of PS in pretest, posttest, and after 6 months. *P = .011: Significant differences between the pretest and posttest values in the ME group. The level of significant was set at 5% (P < .05). Cn/90s indicates correct number in 90 seconds; ME, mental training; PS, processing speed.