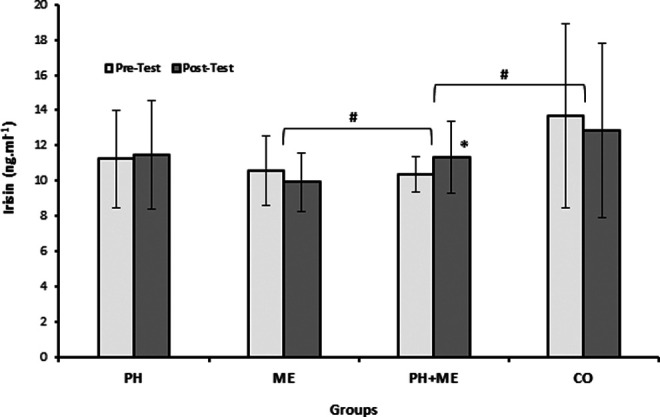
Figure 6.

Pretest and posttest levels of irisin in the groups. *Significant difference compared to pretest (P < .05). #Significant differences between groups in irisin changes (P < .05).

Pretest and posttest levels of irisin in the groups. *Significant difference compared to pretest (P < .05). #Significant differences between groups in irisin changes (P < .05).