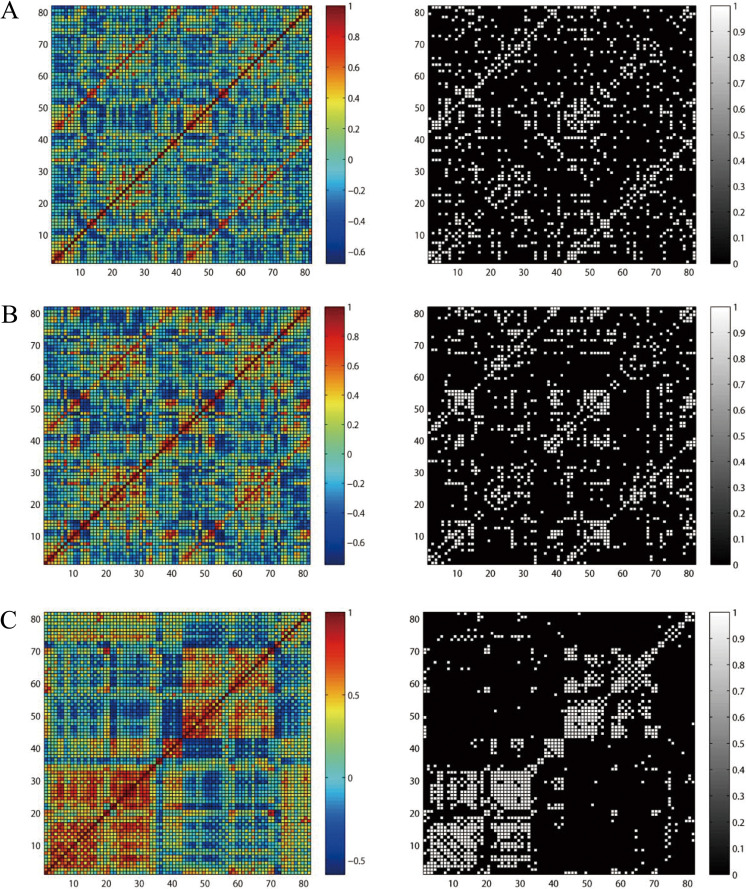
Figure 1.
Metabolism-based connectivity matrices for normal control (NC), mild cognitive impairment (MCI), and Alzheimer’s disease (AD). The color bar showed the strength of the correlations. Pearson correlation matrices in NC (A), MCI (B), and AD (C). Left: weighted correlation matrices, Right: binary matrices. The binary matrices were obtained by sparsity threshold (18%).

