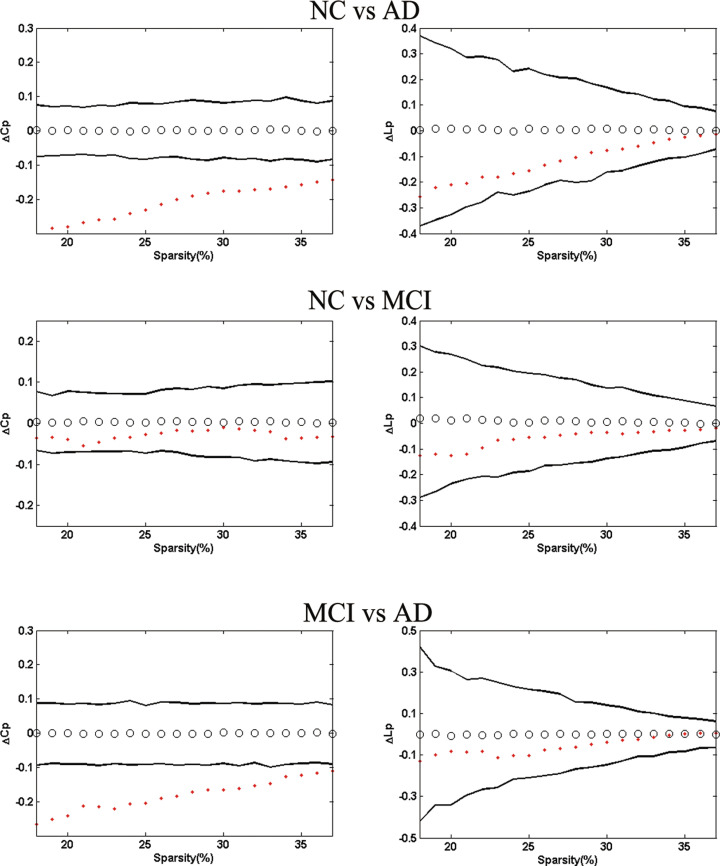
Figure 4.
The left panel shows the between-group differences in clustering coefficients (▵Cp ) and the right panel absolute path lengths (▵Lp ). Top images display delta variables as ▵Cp = C pNC-C pAD and ▵Lp = L pNC-LpAD. Middle images display delta variables as ▵Cp = C pNC-C pMCI and ▵Lp = L pNC-LpMCI. Bottom images display delta variables as ▵Cp = C pMCI-C pAD and ▵Lp = L pMCI-LpAD. The black hollow circles show the average values, and the black lines represent 95% confidence intervals of the between-group differences through 1000 permutation tests per sparsity.

