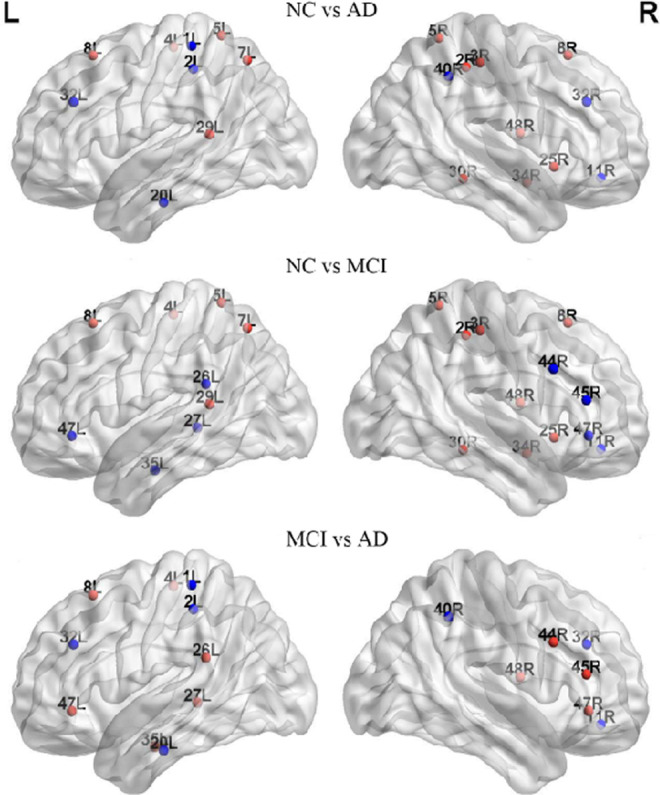
Figure 6.

Brain regions showed abnormal nodal centrality in whole brain networks. All the regions belong to the hub regions, which are at least in 1 network of the 3 groups, and these hub regions indicated the significant between-group differences (P < .05). Regions showing decreased (blue) and increased (red) nodal centrality in former compared to the latter group. L indicates left; R, right.
