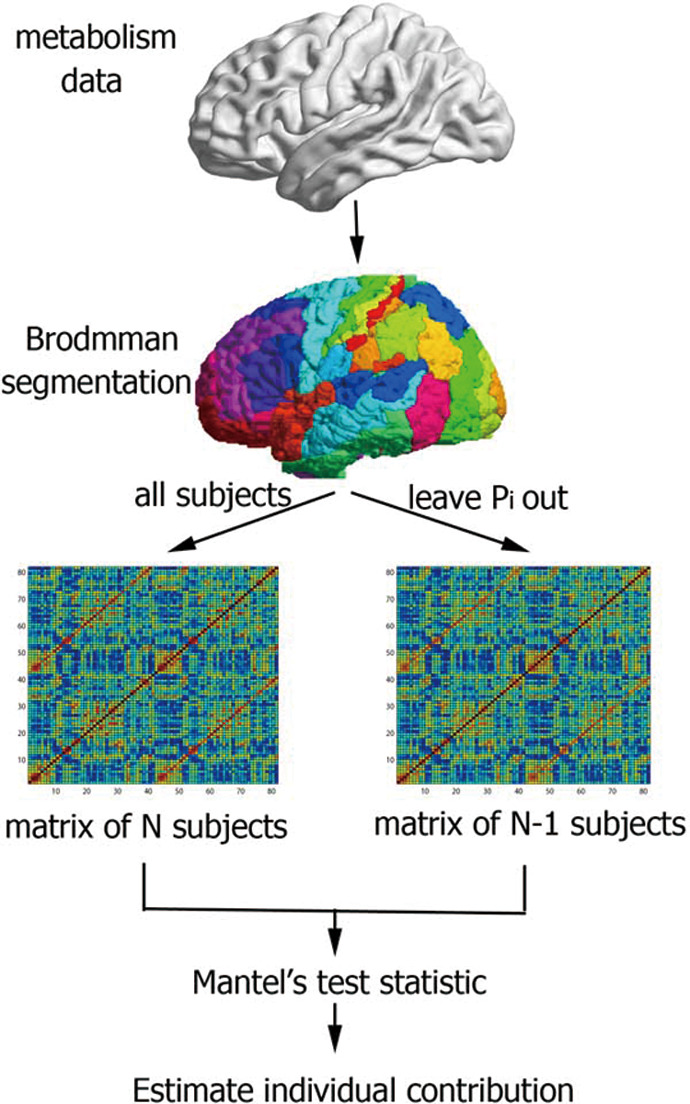
Figure 8.

Flow diagram of the leave-one-out (Loo) approach. Metabolism data were segmented using Brodmann atlas. With the matrix of all and N − 1 participants, the individual contribution can be estimated by Mantel’s test statistic. Pi = 1…N represents the successive removal of Pi from the original group.
