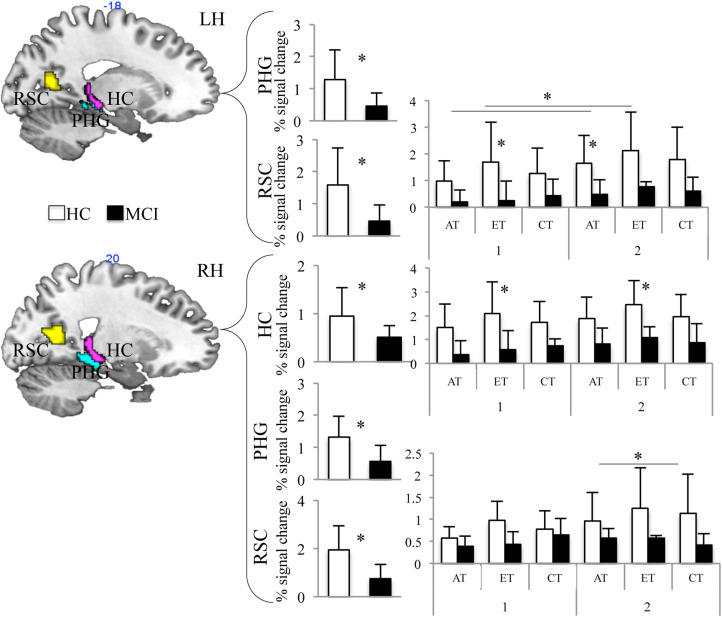
Figure 3.
Results of ROI analysis in HCs (white bars) and aMCIs (black bars) on the 3 experimental tasks performed in the first and second sessions. Percentage BOLD signal change in HC and MCI in the bilateral hippocampus (HC), parahippocampal gyrus (PHG), and retrosplenial cortex (RSC). aMCIs indicates patients with amnestic mild cognitive impairments; AT, allocentric task; BOLD, blood oxygen level-dependent; CT, control task; ET, egocentric task; HCs, healthy controls; MCI, patients with mild cognitive impairment; ROI, region of interest.

