
Figure 1.
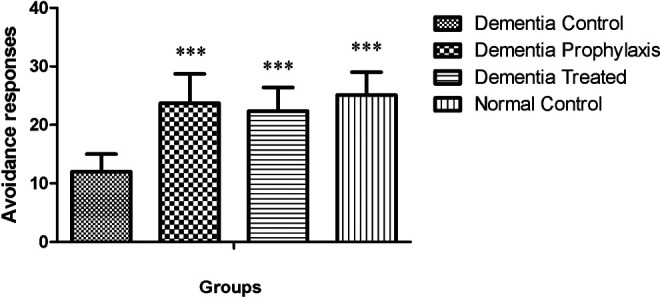
Avoidance responses of different groups in active avoidance training session (n = 7). ** indicates the significant differences in avoidance trials when compared to the DC group, respectively, using repeated measures analysis of variance (ANOVA) followed by Tukey’s multiple comparisons tests.