
Figure 3.
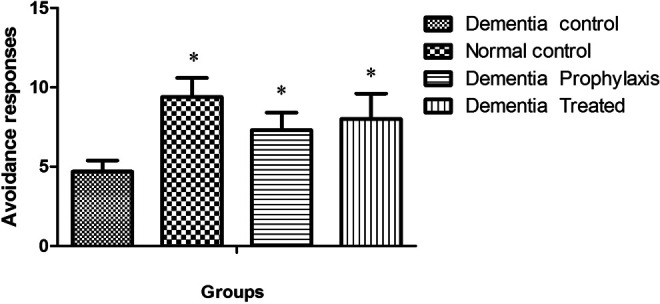
A comparison between the active avoidance responses in different groups 1 month after training session (n = 7). *Indicative of significant difference by P < .05, respectively, as compared with the dementia control (DC) group according to Kruskal-Wallis and Dunn’s multiple comparison tests.