
Figure 2.
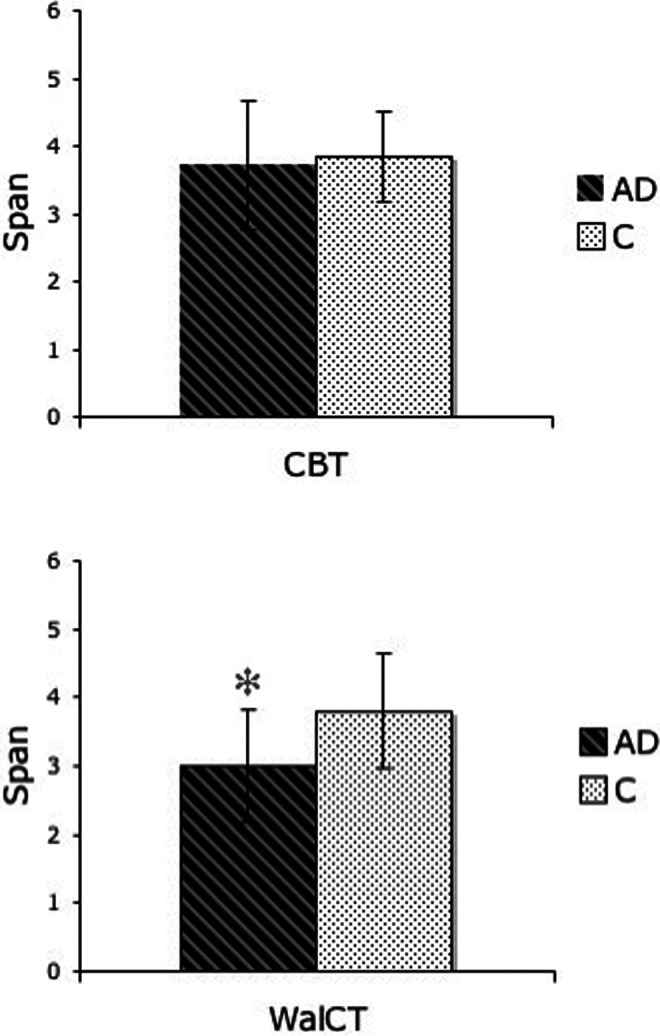
Graphs showing patients with Alzheimer's disease (AD) and C mean and standard deviation (SD) performance on the Corsi Block-Tapping Test (CBT; above) and the WalCT (below). * indicates significance between the group differences.
Official websites use .gov
A
.gov website belongs to an official
government organization in the United States.
Secure .gov websites use HTTPS
A lock (
) or https:// means you've safely
connected to the .gov website. Share sensitive
information only on official, secure websites.
Graphs showing patients with Alzheimer's disease (AD) and C mean and standard deviation (SD) performance on the Corsi Block-Tapping Test (CBT; above) and the WalCT (below). * indicates significance between the group differences.