Figure 2.

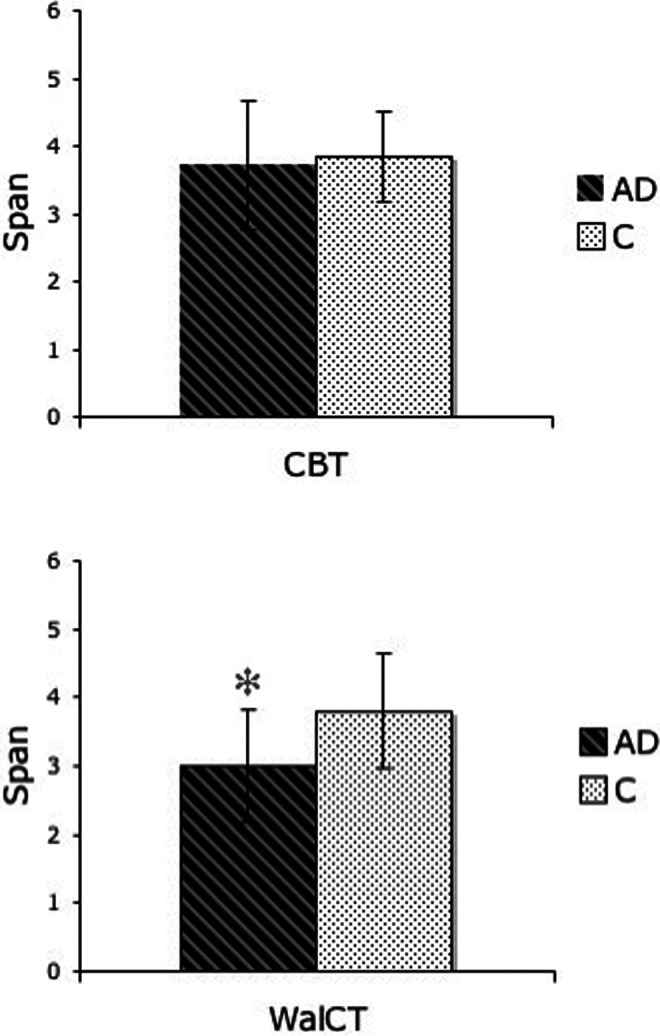
Graphs showing patients with Alzheimer's disease (AD) and C mean and standard deviation (SD) performance on the Corsi Block-Tapping Test (CBT; above) and the WalCT (below). * indicates significance between the group differences.

Graphs showing patients with Alzheimer's disease (AD) and C mean and standard deviation (SD) performance on the Corsi Block-Tapping Test (CBT; above) and the WalCT (below). * indicates significance between the group differences.